4.
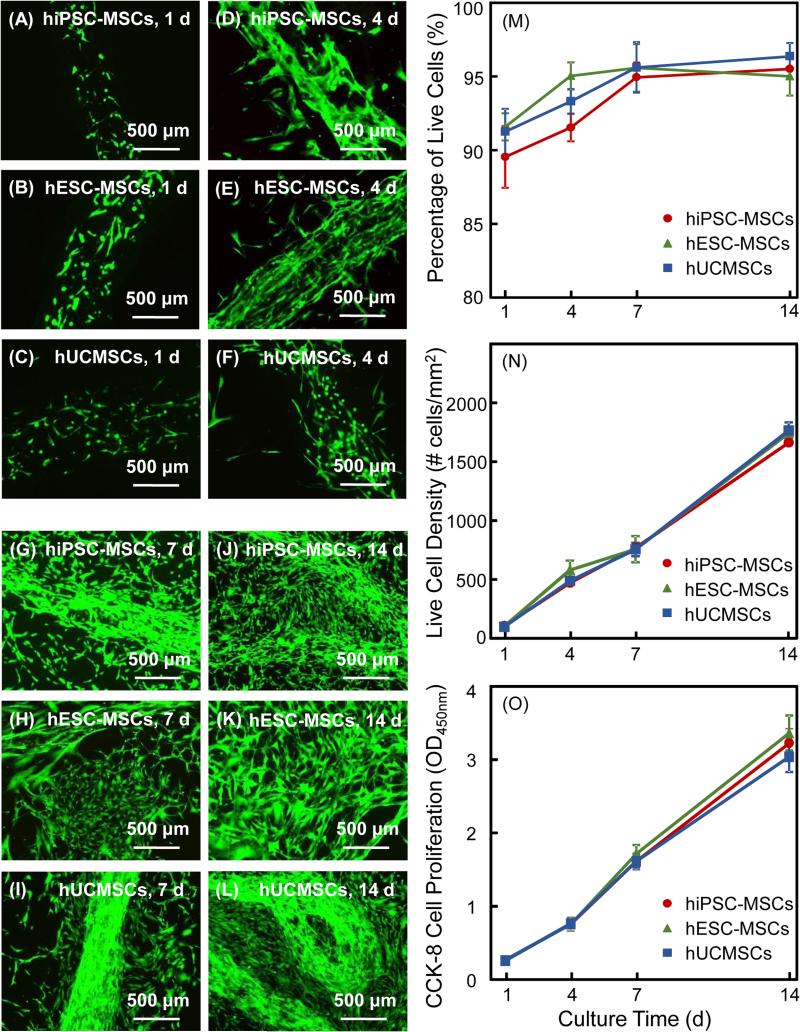
Cell release from CAF and proliferation for hiPSC-MSCs, hESC-MSCs and hUCMSCs vs. time: (A-L) live/dead staining and fluorescence microscopy of cell release to CPC surface. In both cases, at 4 d, cells started to be released from fibers. From 7 to 14 d, more cells were released and the contours of fibers became obscure as they degraded. Live/dead images in showed numerous live cells with few dead cells, and the live cell numbers greatly increased from 1 to 14 d for all three cell types. Proliferation of hiPSC-MSCs, hESC-MSCs and hUCMSCs in CPC-CAF constructs: (M) Percentage of live cells, (N) live cell density, and (O) CCK-8 cell proliferation (mean ± sd; n = 6).

