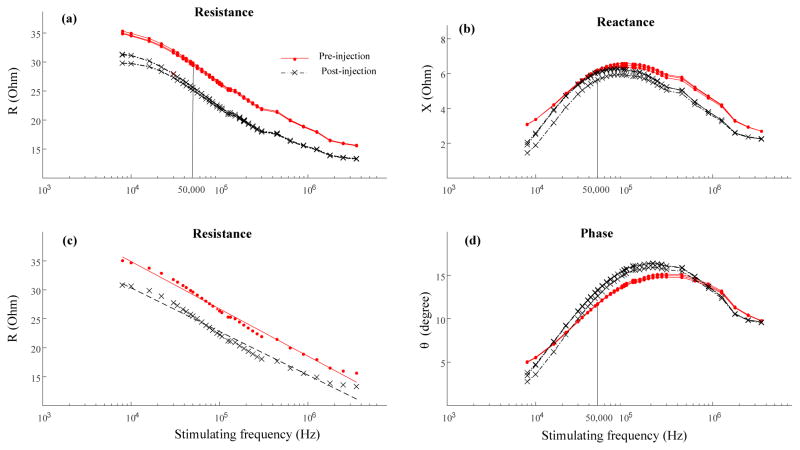
Figure 2.
Semi-log plot of impedance variables across multiple frequencies from a representative stroke subject pre- and post- BoNT-A injection. Each test involved three trials with the ‘Pre-injection’ test marked in red solid lines (or dots) and the ‘Post-injection’ test marked in black dashed lines (or ‘x’). (a) Resistance (R). (b) Reactance (X). (c) Linear relation of resistance and logarithm of frequency (see text for details). (d) Phase angle (θ).

