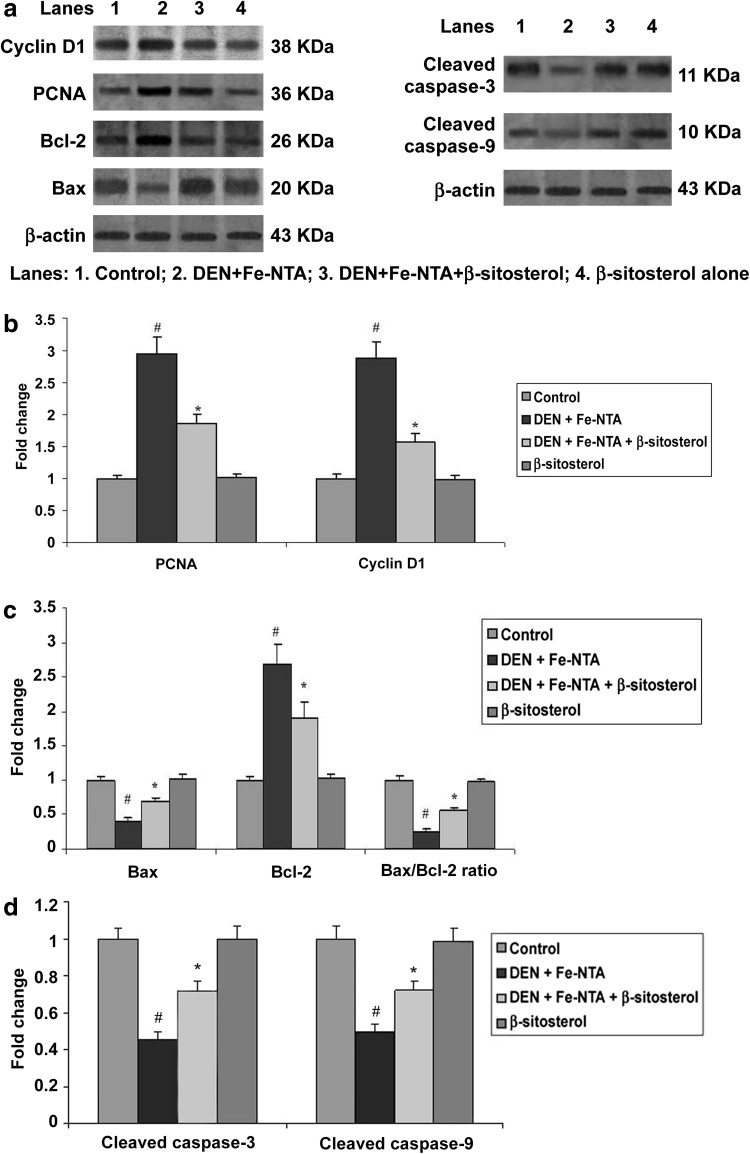
Fig. 1.
Effect of β-sitosterol on Bax, Bcl-2, cleaved caspase-3, cleaved caspase-9, Cyclin D1 and PCNA protein expressions in the kidney tissue of control and experimental rats. For quantitative assessment, the band intensity was measured with a densitometer and normalized to β-actin expression and expressed as fold change with respect to control. The changes relative to control are represented in the bar diagram. Data shown are mean ± SD of four independent experiments. Values not sharing a common superscript differ significantly at P < 0.05 (DMRT)

