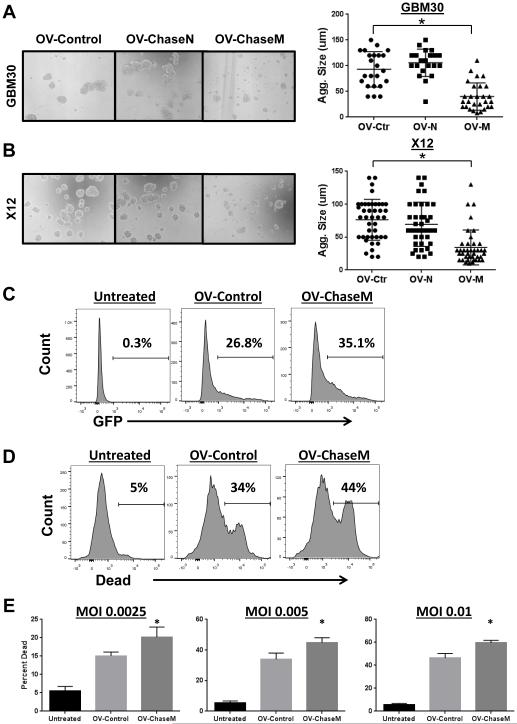
Figure 3. OV-ChaseM enhances viral spread and glioma cell killing. A-B.
Representative 10X magnification light microscopy images for the GBM30 (A) and X12 (B) glioma cell aggregates infected with OV-Control (OV-Ctr), OV‐ChaseN (OV-N) or OV‐ChaseM (OV-M) (MOI of 0.005), 72 hrs post infection. Quantification of individual aggregate sizes (Agg. Size) in random view fields per cell line is indicated to the right. C. Histograms of GFP positive X12 neurospheres (MOI 0.005) five days post infection as determined by flow cytometric analysis using a BD LSR II. D. Representative histograms of dead cells obtained from flow cytometric analysis (using live and dead cell staining; Invitrogen) to determine the killing capacity of OV‐ChaseM versus OV‐Control. E. Quantification of the percentage of dead cells at various MOIs is indicated. *indicates OV‐ChaseM difference when compared to all other treatment groups with p<0.05. All experiments were performed in triplicate with at least three independent replicates.

