
Figure 3.
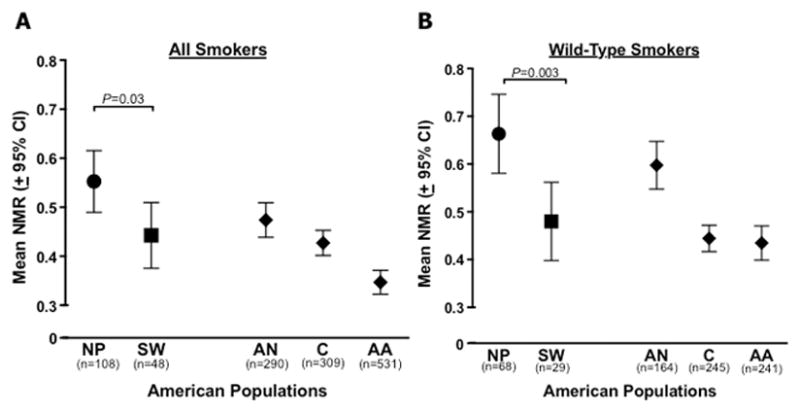
Comparison of CYP2A6 activity (NMR) among the two tribal populations of smokers (NP, Northern Plains; SW, Southwest). (A) All smokers included in analyses, regardless of CYP2A6 genotype. (B) Smokers with wild-type genotypes; *1A/*1A, *1A/*1B, and *1B/*1B genotypes only (CYP2A6 reduced metabolizer (RM) genetic variants were excluded). P values are based on Mann-Whitney tests. Other American smoking populations included for visual comparison (AN, Alaska Native; C, Caucasian; AA, African American). CYP2A6 genotype and NMR data from other American populations taken from the following sources: AN [27]; C [48]; AA [18].