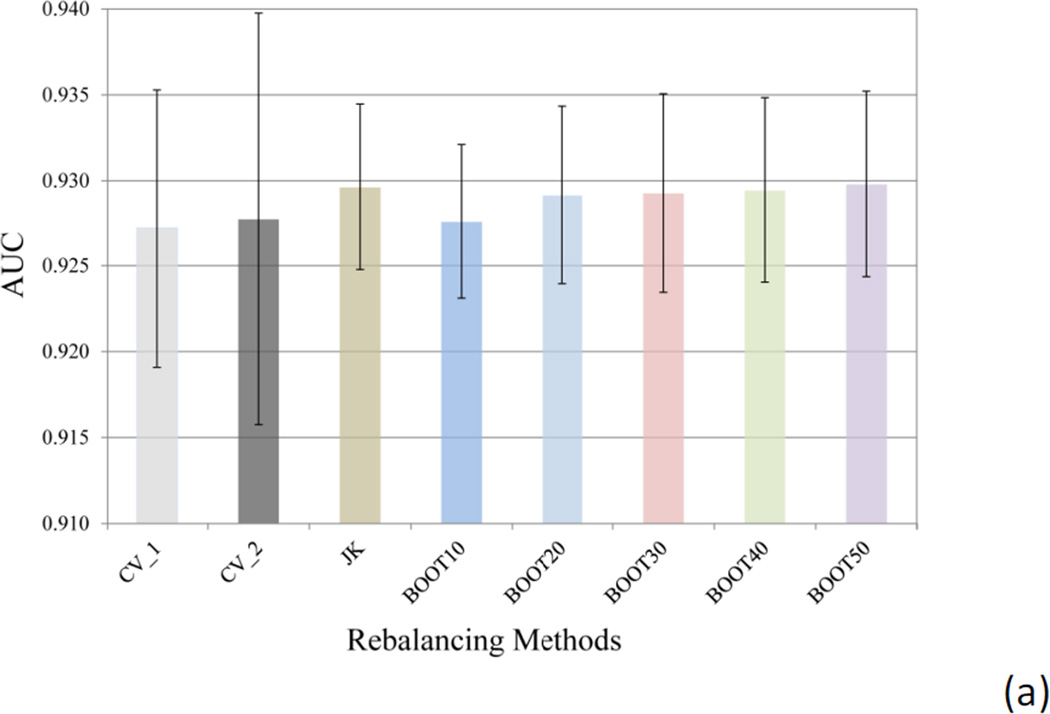
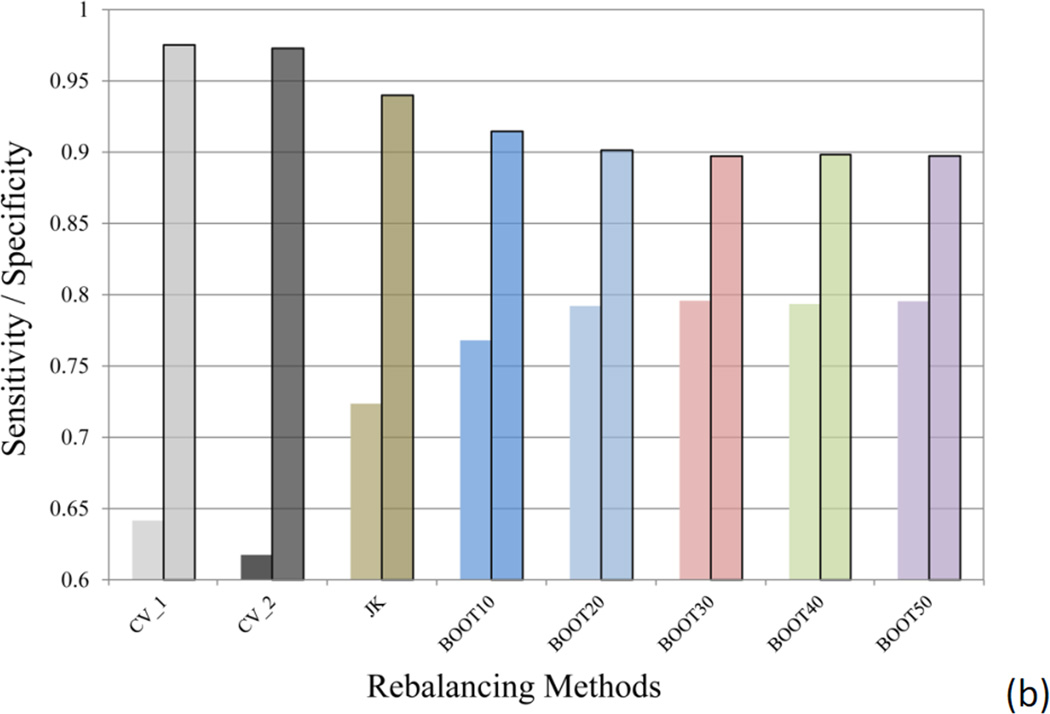
Figure 4.
(a) The averaged area under the curve (AUC) of the 10 receiver operating characteristic (ROC) curves, and (b) the averaged sensitivity and specificity (semi-transparent boxed bars) values for the models using different methods to select training and test sets (CV_1 and CV_2) and the models built with different rebalancing techniques (Jackknifing and bootstrapping). The error bars in (a) indicate the standard deviation (SD) of the AUC values of the ten SVC models.


