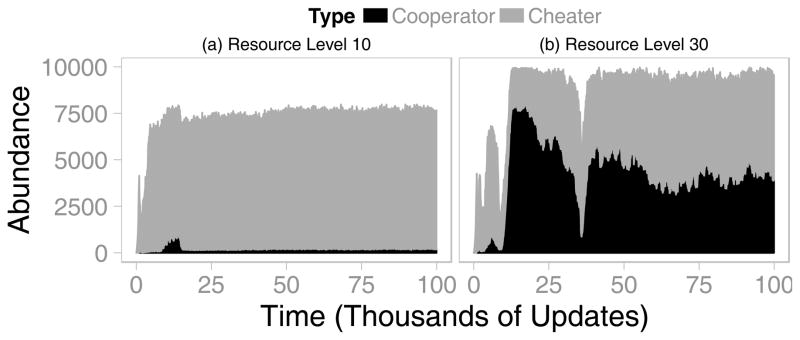
Figure 3. Population Dynamics of Cooperation in Different Environments.
The number of cooperators and cheaters are shown over time in two representative populations. Note that cheater abundances are shown stacked on top of cooperator abundances. (a) In a resource-poor environment, cheaters maintain their initial dominance throughout the simulation. (b) In a resource-rich environment, cooperators quickly rise in abundance immediately after their population is drastically thinned by environmental disturbance. Cheaters nearly drive cooperators to extinction by approximately 35,000 updates. However, the susceptible population was thinned, which once again allowed cooperators to rebound.

