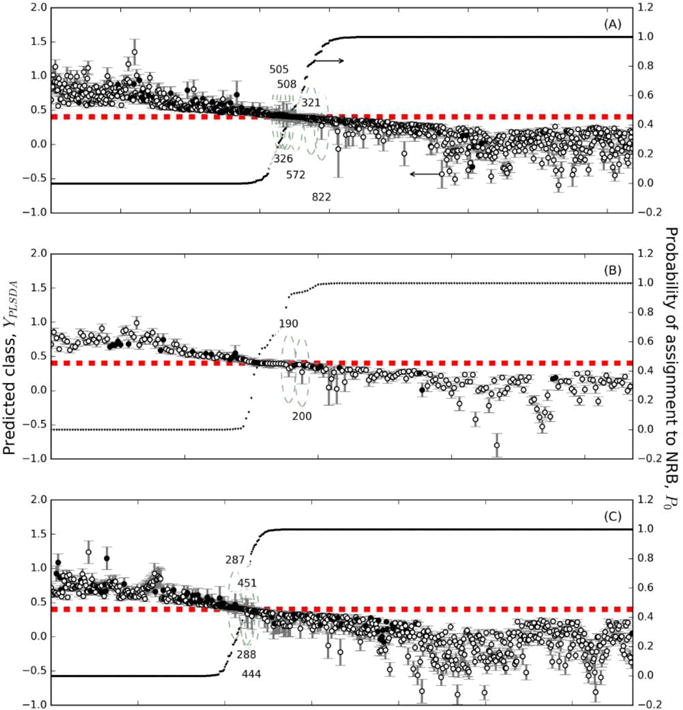
Figure 3.

Classes predicted by the PLS-DA model for the calibration, validation, and external validation sets, with confidence intervals for all substances as estimated by the residual bootstrap method. The class boundary ybound is shown with a dashed line and the probability of assignment to the NRB class is shown with dots. Predicted RB substances have confidence intervals above ybound and predicted NRB substances have confidence intervals below ybound. Substances that are correctly classified are shown with open circles and those that are incorrectly classified are shown with filled circles. (A) Calibration substances, (B) Validation substances, and (C) External Validation substances.
