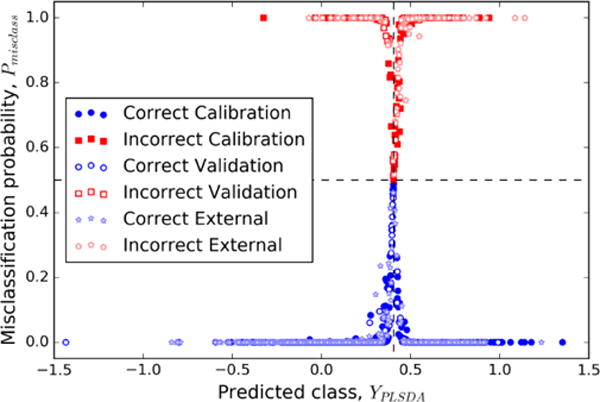
Figure 4.

Misclassification probabilities with respect to classifications predicted by the PLS-DA model. The vertical dashed line indicates ybound, with RB substances to the right and NRB substances to the left. The horizontal dashed line indicates Pmisclass = 0.5, corresponding to the boundary between correctly-classified and misclassified substances.
