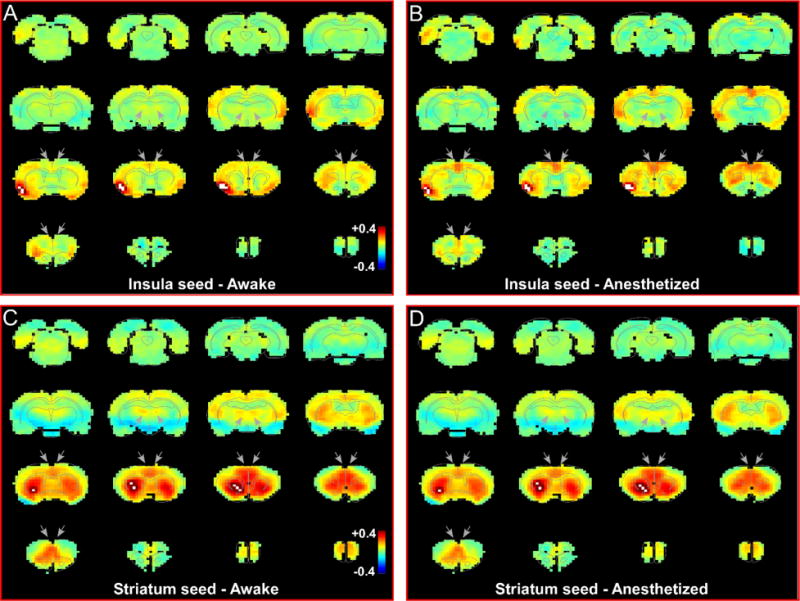
Fig. 4.

Resting state functional network of insular cortex and striatum are different from the claustrum. (a) RS-fMRI analysis with unilateral seed in insular cortex during awake state. Grey arrows indicate regions of high correlation with the claustrum that show no correlation with insula. (b) RS-fMRI analysis with unilateral seed in insular cortex during anesthetized state. (c) RS-fMRI analysis with unilateral seed in striatum during awake state. Grey arrows indicate regions of high correlation with the claustrum. (d) RS-fMRI analysis with unilateral seed in striatum during anesthetized state. White pixels represent seed region. Color bar represents correlation coefficients.
