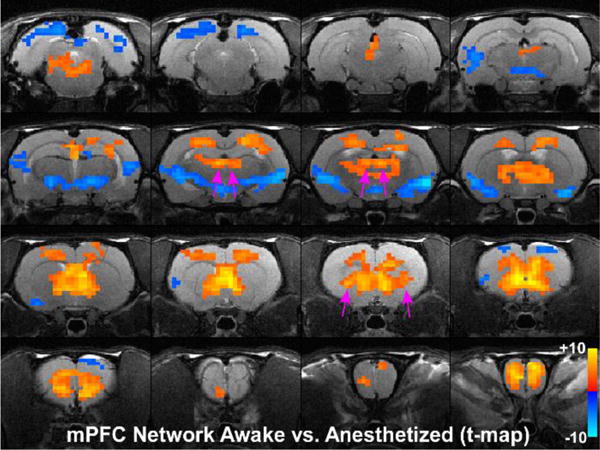
Fig. 6.

Statistical analysis comparing mPFC seed in the awake and anesthetized states. Colored pixels represent significant t-values (two-tailed t-tests) with p<0.05 based on False Discovery Rate that are overlain on the T1 weighted structural MRI template. Positive t-values indicate pixels where functional connections were stronger in the awake state compared to the deeply anesthetized state. Pink arrows point to significant positive t-values for MD-thalamus and claustrum.
