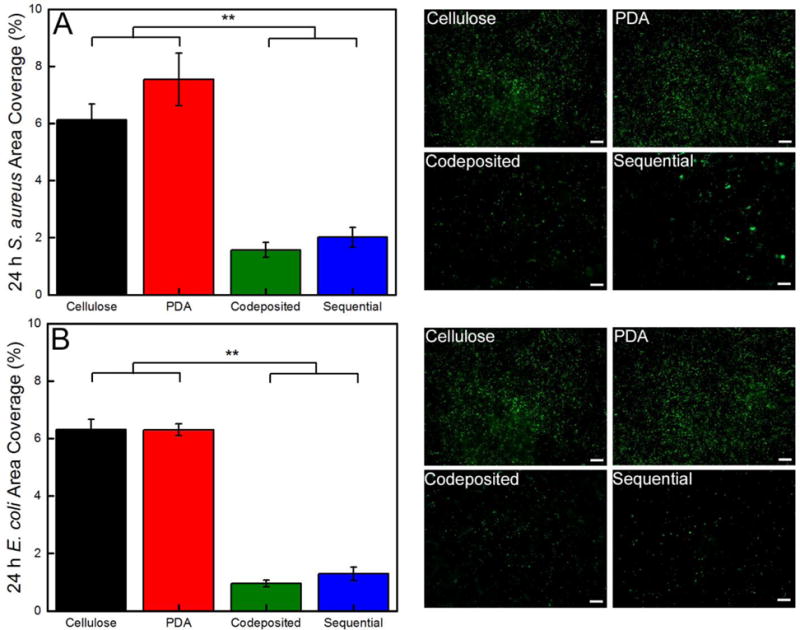
Figure 5.

Quantification of the area coverage of (A) S. aureus and (B) E. coli on the cellulose, PDA, and polyMPC/PDA (sequential and codeposited) functionalized nanofiber mats. Representative florescent micrographs (366964 μm2) are also provided and a 50 μm scale bar is displayed. Error bars denote standard error and two asterisks (**) denotes P ≤ 0.001 significance between samples.
