Figure 7.

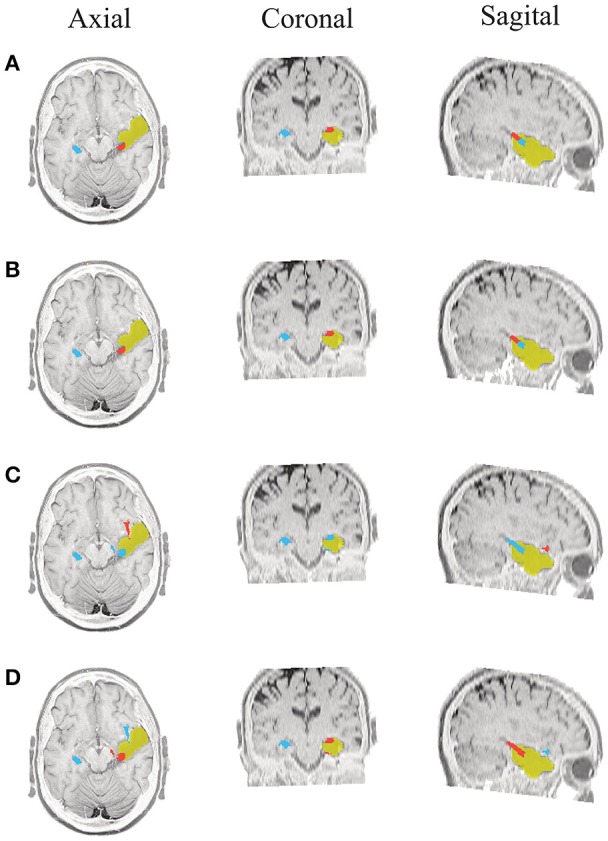
Patient 1 seizure 1 (P1-3). Location of the resected zone (yellow patch), the estimated SOZ (red patch) and the remaining ROIs (blue patches) over the postsurgical MRI image. (A) taMSP-FL-Conn, (B) taMSP-Pow, (C) MSP-Av-Conn, (D) MSP-Pow.

Patient 1 seizure 1 (P1-3). Location of the resected zone (yellow patch), the estimated SOZ (red patch) and the remaining ROIs (blue patches) over the postsurgical MRI image. (A) taMSP-FL-Conn, (B) taMSP-Pow, (C) MSP-Av-Conn, (D) MSP-Pow.