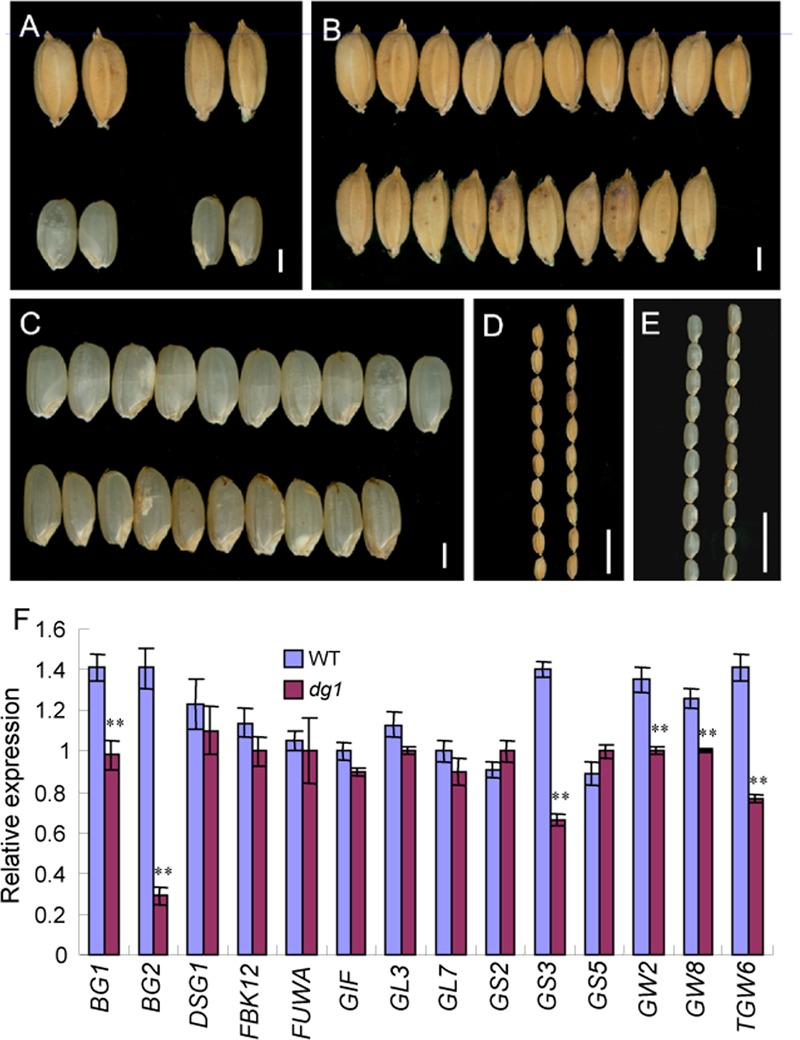
FIGURE 7.

Phenotypic observations of grain and expression analysis of related genes controlling grain size in the wild type and dg1 mutant. (A) Grains phenotype of the wild type (left) and dg1 mutant (right). (B) Grains of the wild type (upper) and dg1 mutant (lower). (C) Brown rice of the wild type (upper) and dg1 mutant (lower). (D) Grains of the wild type (left) and dg1 mutant (right). (E) Brown rice of the wild type (left) and dg1 mutant (right). (F) Expression analysis of related genes controlling grain size in the wild type and dg1 mutant. Total RNA was isolated from the endosperms at 5 days after fertilization. Bars = 2000 μm in (A–C); 1 cm in (D, E). Error bars indicate SD. ∗∗Significant difference at P < 0.01 compared with the wild type by Student’s t-test.
