
FIGURE 9.
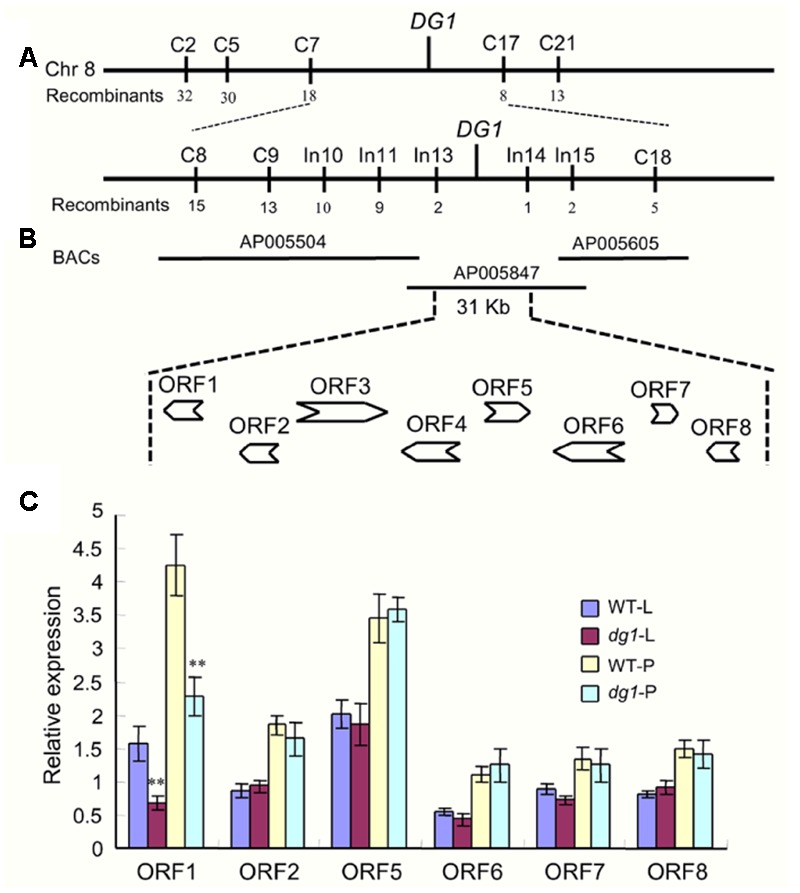
Fine mapping of the DG1 gene and analysis of candidate genes. (A,B) Fine mapping of the DG1 gene. (C) Expression analysis of candidate genes. WT-L, leaf of the wild type at heading stage; dg1-L, leaf of the dg1 mutant at heading stage; WT-P, panicles of the wild type at heading stage; dg1-P, panicles of the dg1 mutant at heading stage. Error bars indicate SD. ∗∗Significant difference at P < 0.01 compared with the wild type by Student’s t-test.