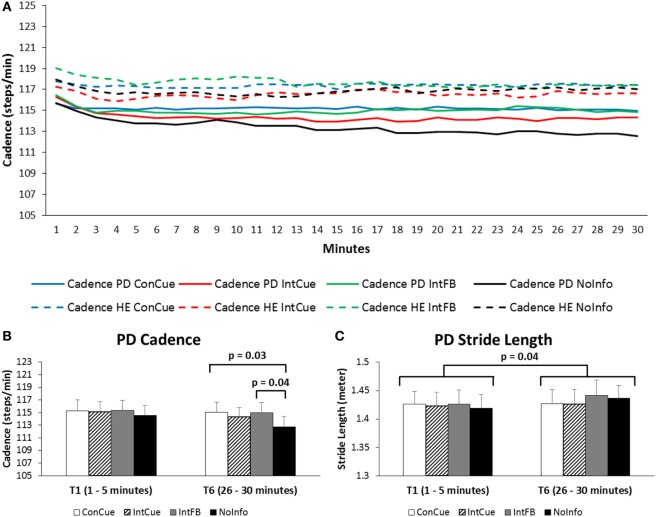
Figure 2.
(A) Progression of cadence over the 30 min in the Parkinson’s disease (PD) and healthy elderly (HE) groups during the four different conditions. Full lines represent the PD group, and dotted lines represent the HE group. Averages of each minute are displayed for the full group. SDs are not displayed for reasons of clarity. See Supplementary Material Table 2 for means and SDs displayed for each 5 min interval. (B) Cadence of the PD group during the first and last time blocks for the four different conditions. Means and SEs (error bars) are displayed. (C) Stride length of the PD group during the first and sixth time blocks for the four different conditions. Means and SEs (error bars) are displayed.

