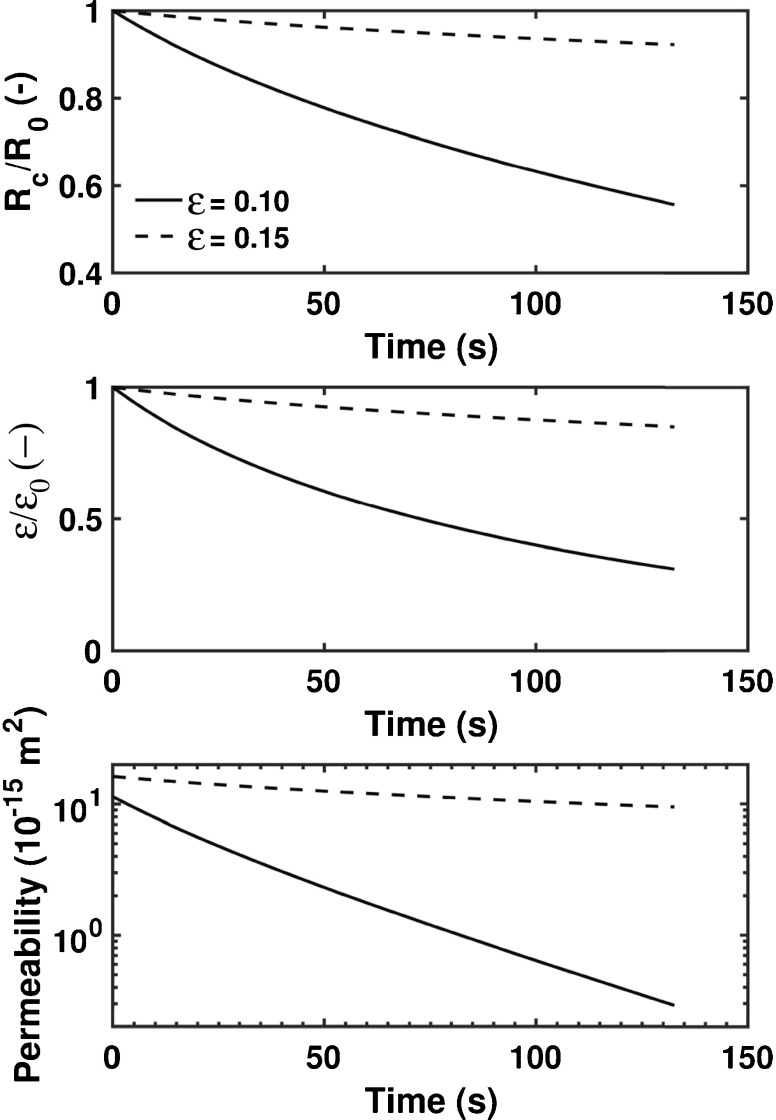
Fig. 18.
Simulation results from modelling the liquid penetration in swelling MCC tablets for two different tablet properties (solid line corresponds to ε 0 = 0.10 and dashed line corresponds to ε 0 = 0.15). R 0: initial pore radius; R c: time-dependent pore radius; ε 0: initial porosity; ε time-dependent porosity. A modified Carman-Kozeny (see Eq. (5) in [208]) was used to model the permeability as function of porosity.

