
FIGURE 3.
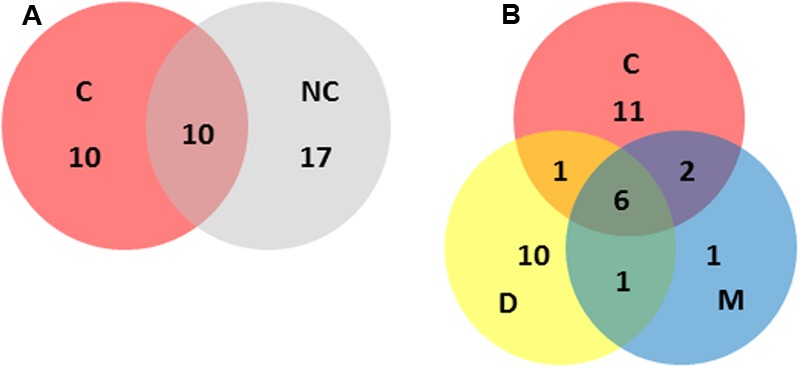
Distribution of STs across the main categories included in this study (i.e., C, clinical; NC, non-clinical; D, dairy; M, meat). Numbers represent the number of different STs unique to, or shared by, the relevant categories. (A) Clinical versus non-clinical ST distributions. (B) Clinical versus dairy versus meat ST distributions.