
FIGURE 4.
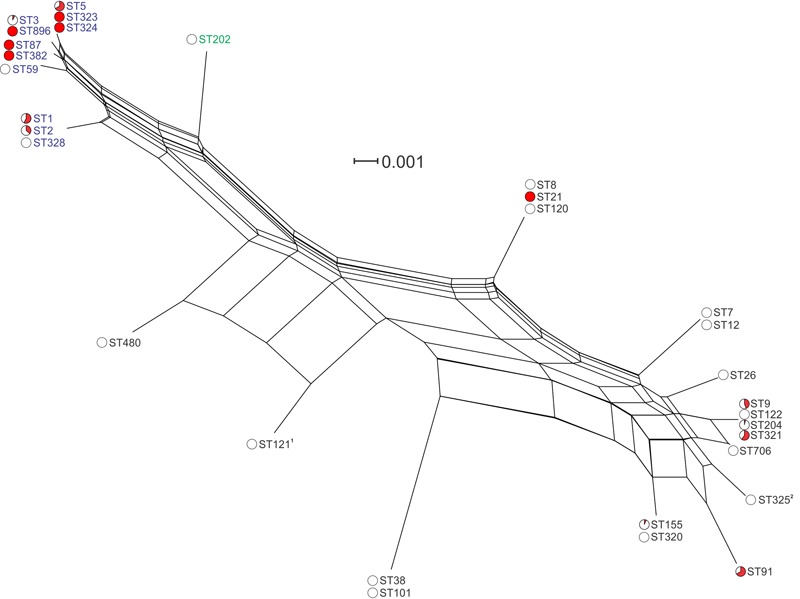
Phylogenetic analysis of inlA gene sequences among isolates in this study. Lineage I STs are labeled in blue, lineage II STs are labeled in black, and lineage III in green. Red coloring in pie charts indicates the proportion of clinical isolates among all isolates of that ST. 1ST121 isolates contained a PMSC at AA492; 2ST325 isolates contained a PMSC at AA93.