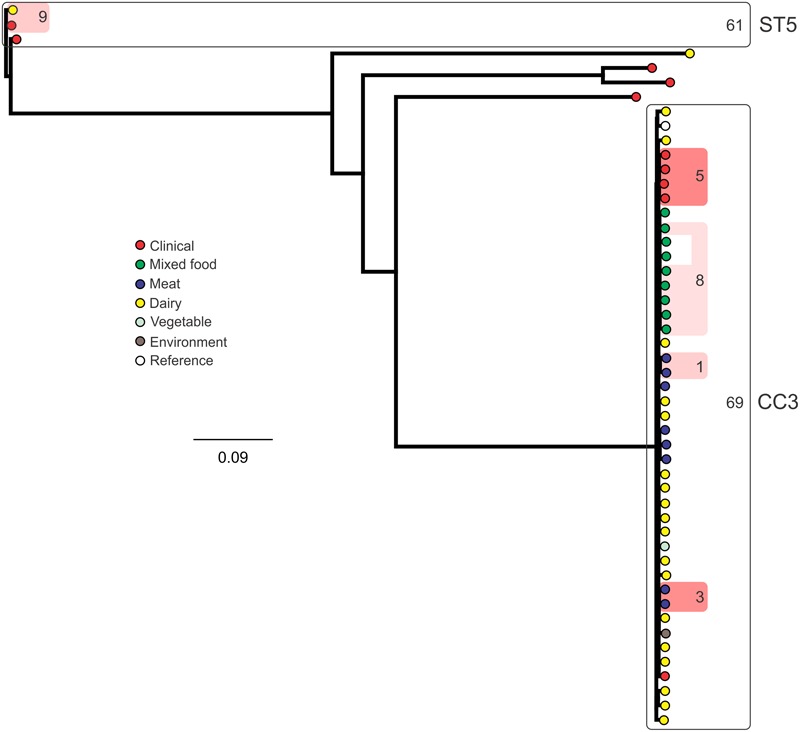
FIGURE 6.

Phylogenetic analysis of serogroup IIB core genome SNPs. CCs and STs containing multiple isolates are indicated by labeled rounded rectangles (the CC or ST is labeled on the outside right, and the number of SNPs is indicated by the number on the inside right of the rectangle). Isolates linked by colored shading are epidemiologically linked, with the number indicating the highest number of SNPs when comparing isolates in that subset.
