
FIGURE 3.
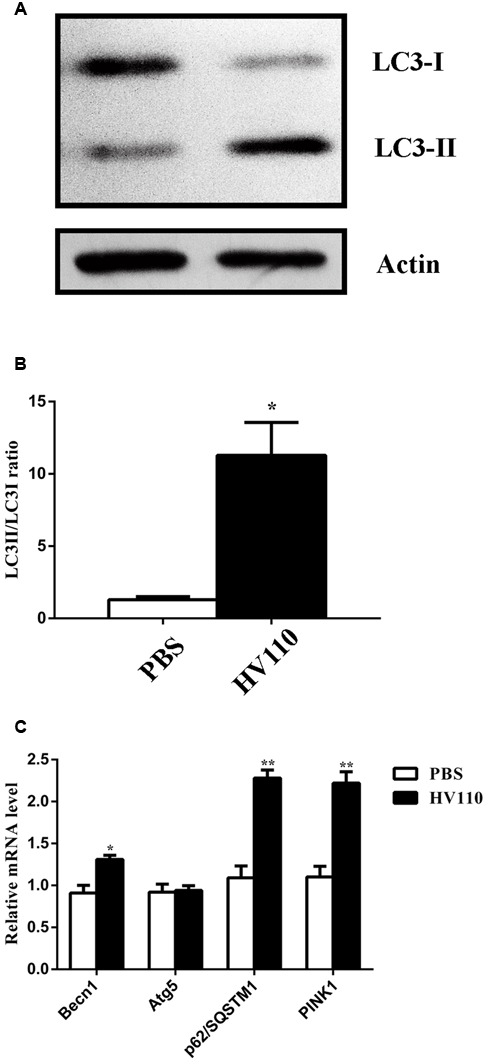
The influence of HV110 on autophagy in HepG2 cells. Representative western blot (A) and densitometric analysis (B, n = 4) of LC3 conversion in HepG2 cells. Quantification of BECN1, Atg5, p62/SQSTM1 and PINK1 mRNA levels (C, n = 3). HepG2 cells were treated with 3 mg/ml of HV110 for 16 h. Student’s t-test was used to compare experimental group relative to control (*p < 0.05, **p < 0.01).