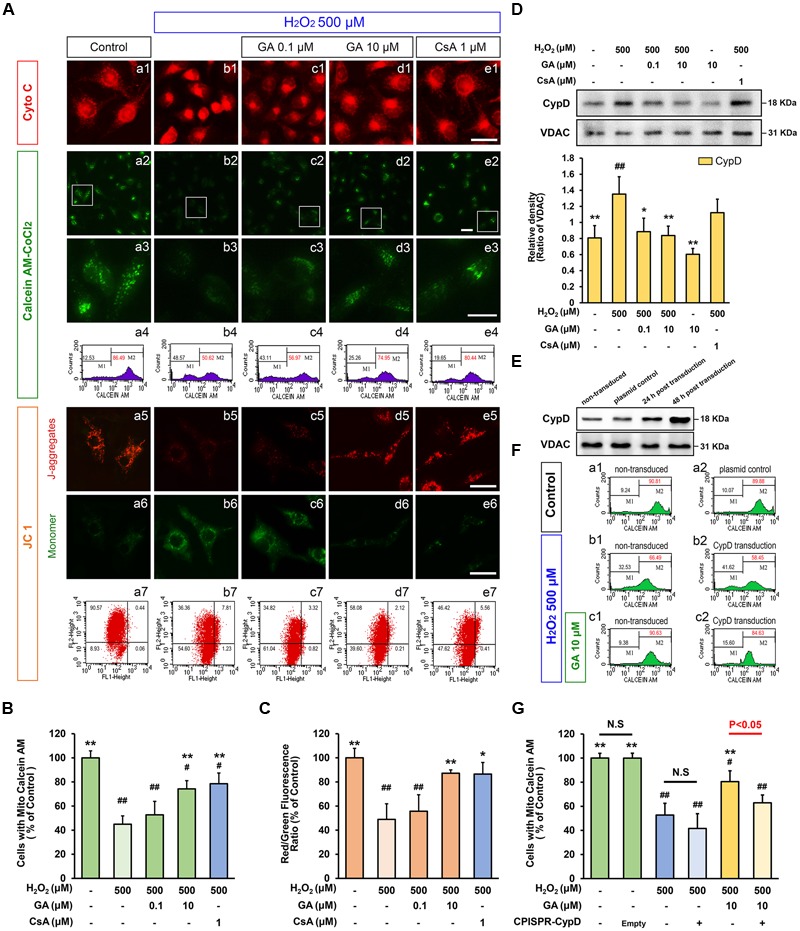
FIGURE 4.

Gallic acid desensitizes the MPTP induced by H2O2 in a CypD-dependent manner. GA decreased the sensitivity of H2O2-induced MPTP induction in SH-SY5Y cells. (A-a1–e1) Representative endogenous Cyto C release in SH-SY5Y cells by Immunofluorescence analysis. (A-a2–e2) MPTP determined by Calcein-CoCl2 fluorescence. (A-a3–e3) Higher magnification and quantification (A-a4–e4) the calcein fluorescence tested by flow cytometry. The representative images show JC-1 aggregates (A-a5–e5), monomers images (A-a6–e6), and quantification (A-a7–e7) the JC-1 by flow cytometry, respectively. Histogram showing the level of calcein fluorescence (B), and the ratio of JC-1 aggregates to JC-1 monomers (C; n = 4). Therapeutic effect of GA on MPTP inhibition was reversed by overexpression of CypD in SH-SY5Y cells. (D) Western blotting (upper) and quantification (lower) for mitochondrial CypD in SH-SY5Y cells pre-treated with GA or CsA following H2O2 for 4 h (n = 4). (E) Transfection efficiency was examined with Western Bolting. VDAC was used to loading control. (F-a1,a2) The levels of calcein fluorescence transfected with CypD or plasmid control, and treated with (F-c1,c2) or without (F-b1,b2) GA under H2O2 conditions were (G) quantificated by flow cytometry (n = 4). Scale bars, 5 μm. Data reported as the means ± SD. P values were obtained using two-way analysis of variance (ANOVA) test. N.S. indicates a P value > 0.05. ##P < 0.01, #P < 0.05 versus control group. ∗∗P < 0.01, ∗P < 0.05 versus H2O2 group.
