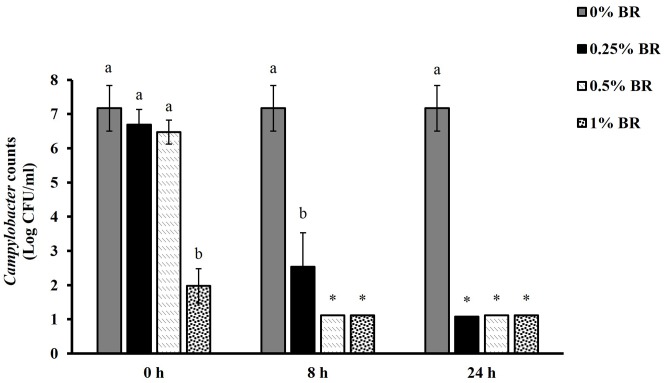
FIGURE 1.
Reduction of Campylobacter counts in cecal contents by different concentrations (0, 0.25, 0.50, and 1%) of BR at 0, 8, and 24 h. Results are averages of three independent experiments, each containing duplicate samples (mean and SEM). Bars with different letters represent a significant difference between treatments (P < 0.05). ∗Indicates Campylobacter counts below the detection limit (1 Log CFU/ml).

