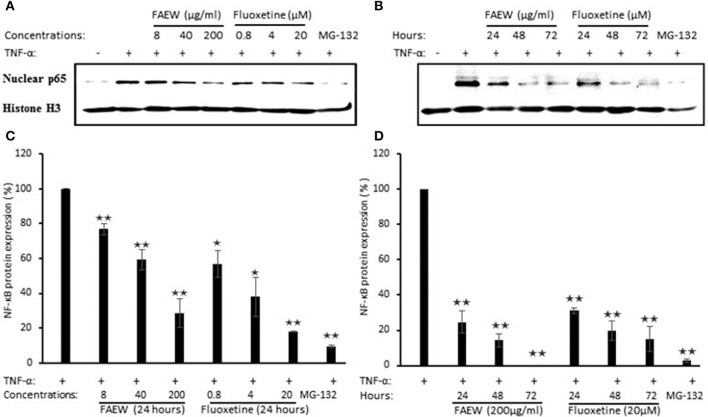
Figure 8.
Inhibition of p65 expression by FAEW and fluoxetine in T98G brain cells. (A) Concentration kinetics and (B) time kinetics. Histone was used as loading control. (C,D) show the quantification of western blots shown in (A,B), respectively. The inhibition effects of FAEW and fluoxetine toward p65 protein expression were calculated by comparison with untreated TNF-α induction group after using the control group without TNF-α for the quantification of western blots. Shown are mean values ± SD of three independent experiments. *p < 0.05, **p < 0.01.

