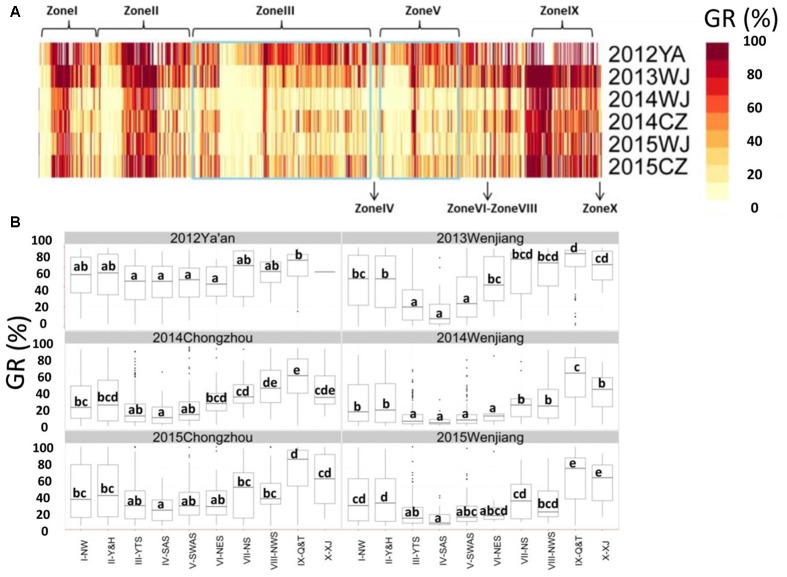
FIGURE 2.
Phenotypic analysis for germination rate (GR) obtained by Chinese wheat landraces. (A) GR of Chinese wheat landraces grown from 2012 to 2015 at Wenjiang, Chongzhou, and Ya’an; (B) Box plot for GR obtained by accessions grouped according to origin (i.e., the 10 major agro-ecological production zones of China). The middle horizontal line within each box represents the mean GR and vertical lines mark the range from 5 to 95% of the total GR within each group.

