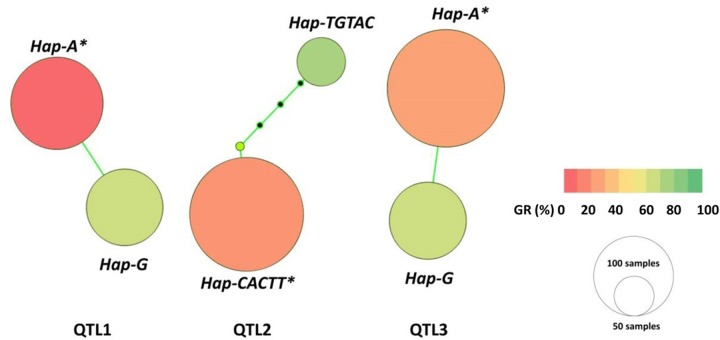
FIGURE 4.
Haplotype networks for the three main QTL. The nodes represent variants for the haplotype blocks, with sizes proportional to the number of genotypes carrying the respective variant and colors indicating phenotypic means among genotypes carrying the specific haplotype variant. ∗The germination rate for accessions carrying the favorable haplotype is significantly lower than accessions carrying the unfavorable haplotype (p < 0.01).

