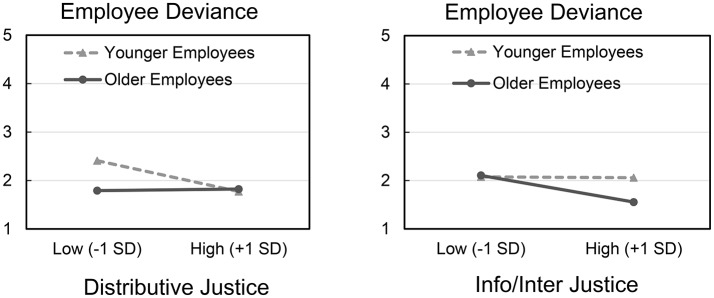
Figure 2.
(Left) Study 1 interaction between age and distributive justice on employee deviance (1–5), plotted at ±1 SD around the means on the continuous predictors. (Right) Study 1 interaction between age and informational/interpersonal justice on employee deviance, plotted at ±1 SD around the means on the continuous predictors.

