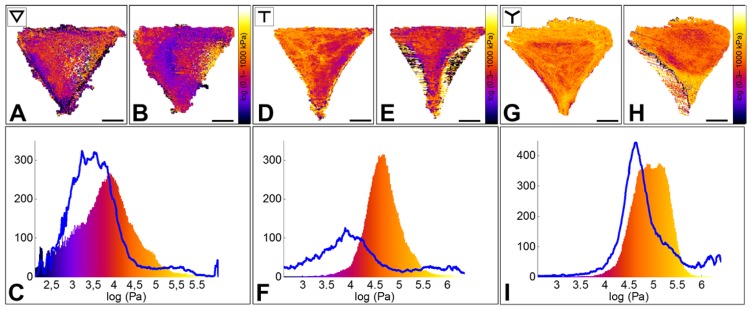
Figure 5. Effect of Blebbistatin (−) on the Young’s modulus of RPE1 cells plated on ▽ -, T - and Y micropatterns.
A, D, G. Elasticity maps of single cells plated, respectively, on a ▽-, T- and Y- shaped micropatterns before Blebbistatin addition.
B, E, H. Elasticity maps of the same cells ~40 min after drug addition.
C, F, I. Elasticity distribution of the same cells before (color-coded histogram) and after drug addition (blue line). Cells show a 5 to 10-fold decrease of the Young’s modulus. Such decrease is observed in the peripheral regions, but not on the nucleus, which appears to maintain its elastic properties after the disruption of acto-myosin fibers, similarly to what observe after Latrunculin A injection.

