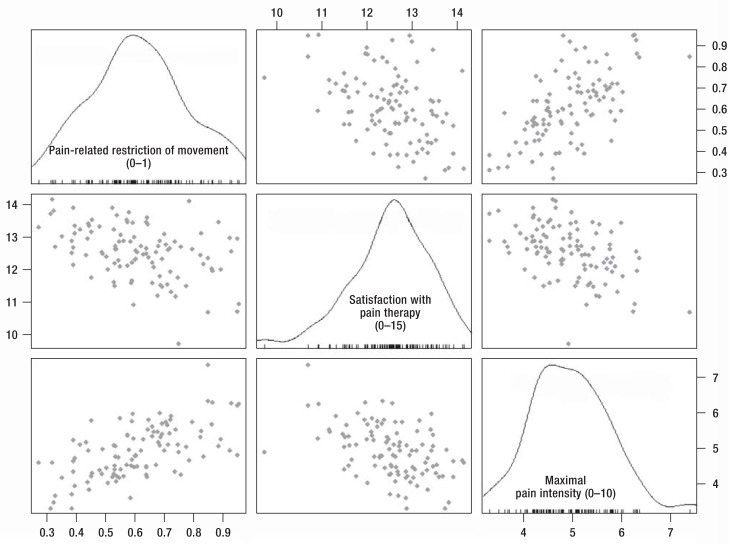
eFigure 4.
Uni- and bivariate distribution of mean responses for the three untransformed parameters of outcome quality from the patient’s perspective for the four operations analyzed. Each dot summarizes one hospital (N = 103); the univariate distributions (expressed as estimated density distributions) are shown along the diagonals

