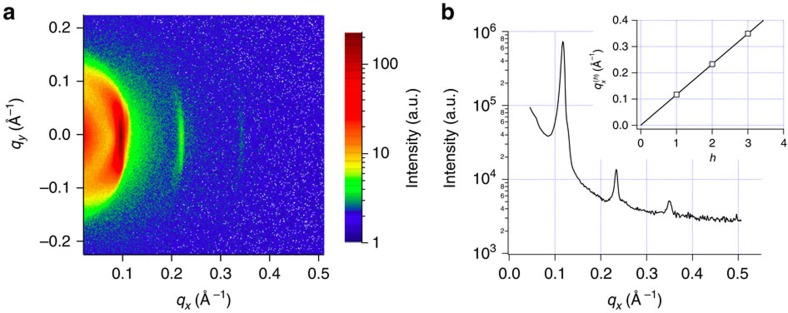
Figure 7. Lamellar period at excess hydration.
Neutron diffraction of pure DGDG measured in excess D2O between two silicon wafers. (a) 2D diffraction pattern. (b) 1D reduced curve. The insert is a plot of the Bragg reflection (h=1 to 3) positions versus h. The solid line is a linear fit to the experimental points yielding a period of 54.0±0.1 Å.

