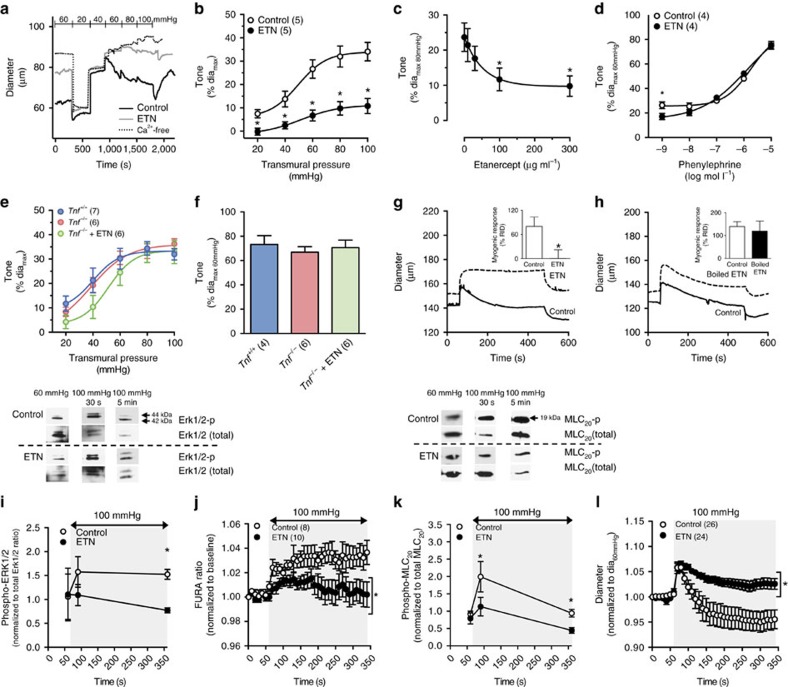
Figure 4. Acute TNF scavenging attenuates myogenic vasoconstriction.
(a) Representative traces of myogenic vasoconstriction in mouse cremaster arteries in the presence of ETN (300 μg ml−1 in vitro) and (b) statistical comparison. (c) Dose-dependency of ETN's effect at 80 mm Hg (n=5 arteries at 0, 7 at 10, 6 at 30, 6 at 100 and 5 at 300 μg ml−1). (d) Phenylephrine-stimulated vasoconstriction (ETN, 300 μg ml−1). (e) Myogenic and (f) 10 μmol l−1 phenylephrine-stimulated vasoconstriction in cremaster arteries from Tnf+/+ and Tnf−/− with and without ETN (300 μg ml−1). (g,h) Representative traces shown of myogenic vasoconstriction (45–100 mm Hg pressure step) in hamster gracilis arteries with (g) native ETN (10 μg ml−1; inset: comparison in n=6 arteries per group) and (h) heat-denatured ETN (10 μg ml−1; inset: comparison in n=6 arteries per group). Myogenic responses displayed as reversal of initial distension (RID). (i) Western blot assessments of ERK1/2 phosphorylation (60–100 mm Hg pressure step; control: n=4 at 60, 5 at 90 and 4 at 360 s; ETN: n=3 at 60, 5 at 90 and 4 at 360 s). Representative images above and uncropped images in Supplementary Fig. 3a–h. (j) Intracellular Ca2+ (60–100 mm Hg pressure step). (k) Western blot assessments of MLC20 phosphorylation (60–100 mm Hg pressure step; control: n=11 at 60, 6 at 90 and 7 at 360 s; ETN: n=4 at 60, 6 at 90, and 5 at 360 s). Representative images above and uncropped images in Supplementary Fig. 3i–n. (l) Myogenic response (60–100 mm Hg pressure step; normalized to 10 s average baseline diameter; control: 62±2, ETN: 68±2 μm). Shading denotes 100 mm Hg. Parentheses indicate number of arteries per group. Data are mean±s.e.m.; *P<0.05 in Student's unpaired t-test (b,d,i–l), in Dunnett's post hoc comparison to concentration 0 following a one-way ANOVA (c), and Student's paired t-test (g,h, insets). In (e,f), the one-way ANOVAs are nonsignificant. ANOVA, analysis of variance.

