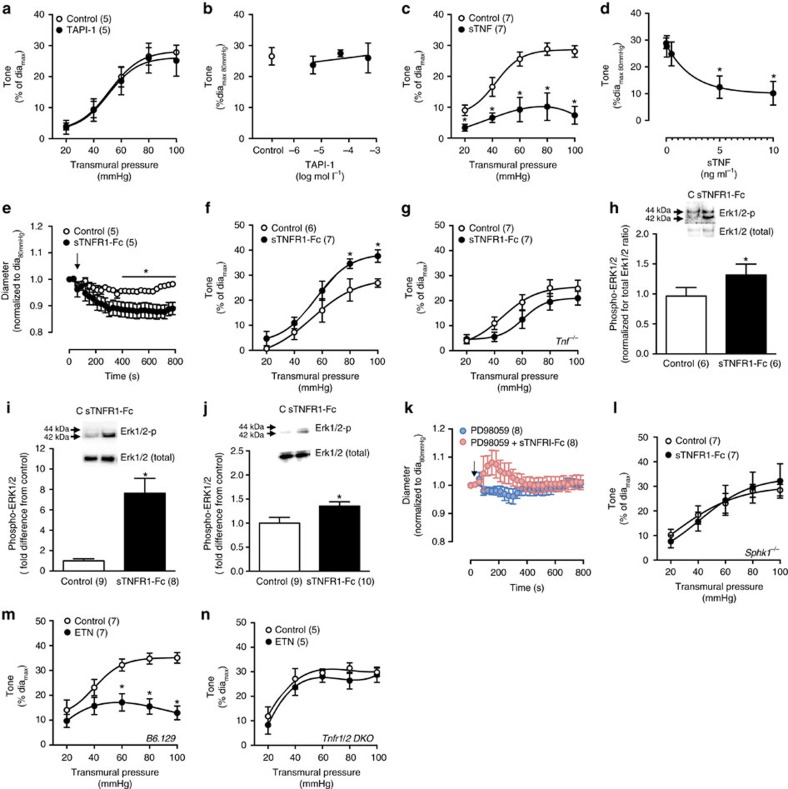
Figure 7. TNF reverse signalling in the myogenic response.
(a) Myogenic responses in the presence of the TNF converting enzyme inhibitor TAPI-1 (500 μmol l−1 in vitro) and (b) dose-dependency assessment at 80 mm Hg (control: n=5 arteries; 5 at −5.3, 4 at −4.3, 5 at −3.3 log mol l−1 TAPI-1). (c) Myogenic responses in the presence of recombinant soluble TNF (sTNF, 10 ng ml−1 in vitro) and (d) dose-dependency assessment at 80 mm Hg (n=7 arteries at 0, 5 at 0.05, 7 at 0.5, 6 at 5 and 6 at 10 ng ml−1 sTNF). (e) Wild-type cremaster artery diameter measurements at 80 mm Hg transmural pressure following application of an intrinsically active soluble TNFR1 fragment (sTNFR1-Fc; 100 ng ml−1, arrow); data are normalized to baseline diameter (10 s average control: 51±5, sTNFR1-Fc: 51±5). (f,g) Myogenic responses conducted in the presence of sTNFR1-Fc in vitro (100 ng ml−1) in (f) wild-type and (g) Tnf−/− cremaster arteries. (h–j) Representative western blot assessments and statistical analysis of ERK1/2 phosphorylation under control condition (C) and following sTNFR1-Fc (100 ng ml−1) application to (h) cremaster arteries at 80 mm Hg transmural pressure, (i) cultured mouse mesenteric vascular smooth muscle cells, and (j) cultured human coronary artery smooth muscle cells. Uncropped western blot images are shown in Supplementary Fig. 10. (k) Wild-type cremaster artery diameter measurements at 80 mm Hg transmural pressure following application of sTNFR1-Fc (100 ng ml−1, arrow) in the presence of 10 μmol l−1 PD98059; data are normalized to baseline diameter (10 s average control: 51±4, sTNFR1-Fc: 51±4). (l) Myogenic responses in the presence of sTNFR1-Fc in vitro (100 ng ml−1) in cremaster arteries isolated from Sphk1−/− mice. (m,n) Myogenic responses in cremaster arteries isolated from (m) B6.129 wild-type controls and (n) Tnfr1/2 DKO mice in the presence and absence of etanercept (ETN, 300 μg ml−1 in vitro). Numbers in parentheses indicate the number of arteries per experimental group (a,c,e–g,k–n) or the number of replicates per experimental group (h–j) All data are mean±s.e.m. *P<0.05 for unpaired Student's t-test (a,c,e–g,i–n), paired Student's t-test (h, paired within blot), and one-way ANOVA with Dunnett's post hoc comparison to concentration 0 (b,d). ANOVA, analysis of variance.

