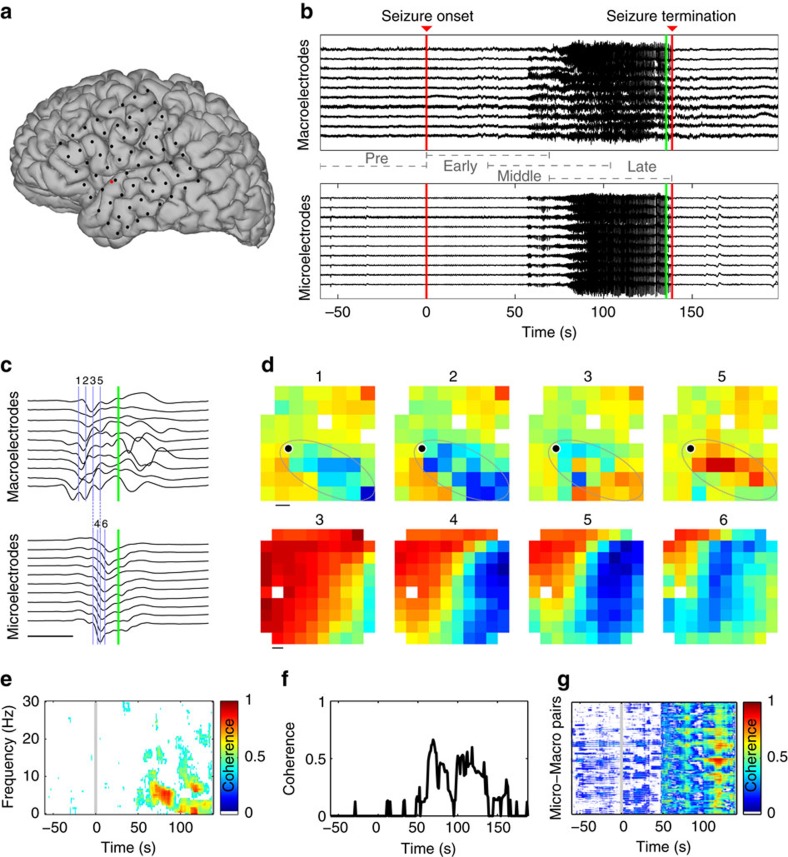
Figure 1. Analysis of coherence within and between spatial scales reveals evolution of inter-scale coupling during seizure.
(a) Example electrode configuration at the macroscopic and microscopic spatial scales. Each black circle indicates a macroelectrode on the cortical surface. The red circle indicates the location of a 4 mm by 4 mm microelectrode array containing 96 electrodes. (b,c) Example voltage traces recorded simultaneously from macroelectrodes (upper) and microelectrodes (lower) during (b) seizure and during (c) a single spike-and-wave event. The green vertical bars indicate the same time point in both subfigures. The blue vertical bars and labels in c correspond to the voltage maps in d. Four intervals (pre-seizure, early seizure, middle seizure and late seizure) are indicated in b. Scale bar in c indicates 100 ms (c). (d) Example voltage maps from the macroelectrodes (upper) and microelectrodes (lower) during the spike-and-wave event in (c). Warm (cool) colours indicate high (low) voltages. Maps labelled 1, 2, 3 and 5 are spaced by 16 ms, while maps labelled 3, 4, 5 and 6 are spaced by 8 ms (see vertical blue bars in c). The approximate area of macroscopic propagation is indicated by a grey ellipse in the top row. Upper scale bar indicates 1 cm, lower scale bar indicates 0.4 mm. (e) Example coherogram between a microelectrode and macroelectrode pair. Warm (cool) colours indicate high (low) coherence. Only significant coherence values are shown (P<0.005, not corrected for multiple comparisons, see Methods). (f,g) Average coherence from 1 to 13 Hz between (f) the microelectrode and macroelectrode pair in (e), and (g) all microelectrode-to-macroelectrode pairs versus time. In g, warm (cool) colours indicate high (low) coherence.

