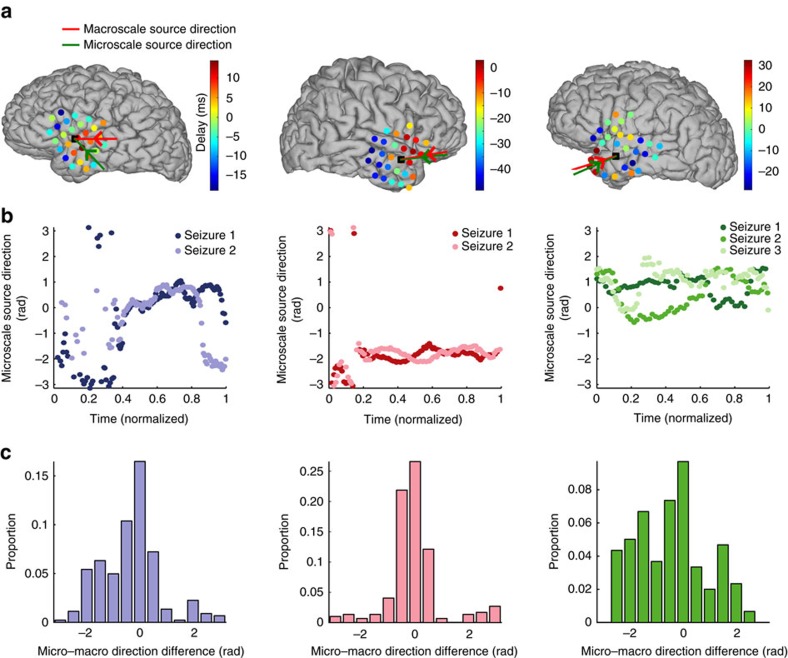
Figure 4. Waves propagate in similar directions across a patient's seizures and between spatial scales.
(a) Average delay at each macroelectrode (circles) and source direction at the macroscale (red arrow) and microscale (green arrow) for each patient during a single seizure. Delays range from 32 ms to −48 ms. The location of the MEA is indicated by a black square. (b) The source directions at the microscale versus (normalized) time are similar for each seizure (colour) of the three patients, but not between patients. (c) The distribution of circular direction differences between the source directions at the microscale and macroscale during seizure concentrate near 0.

