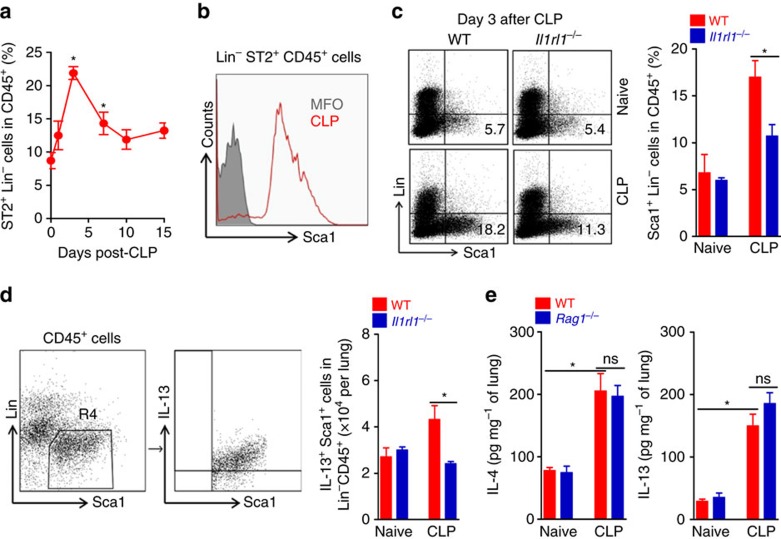
Figure 2. Induction of ILC2 in sepsis-surviving mice.
(a–e) Lungs were harvested from BALB/c and Il1rl1−/− mice up to 15 days after CLP. (a) The frequency of ILC2+ cells in WT mice was determined by FACS at the indicated times after CLP (n≥3 mice per group). (b) Histogram of ILC2+ cells (Sca1+ in Lin−CD45+ cells) in WT mice on day 7 after CLP. MFO, fluorescence minus one. (c) Representative FACS plots and frequency of ILC2+ cells in BALB/c and Il1rl1−/− mice at day 3 after CLP (n≥3 mice per group). (d) Representative FACS plots and total numbers of IL-13-producing ILC2+ (IL-13+Sca1+Lin−CD45+) cells (n=5 mice per group). (e) IL-4 and IL-13 concentrations in the lung tissue of C57BL/6 J and Rag1−/− mice 15 days after CLP determined by ELISA (n≥5 mice per group). *P<0.05 and **P<0.01 (one-way ANOVA result with Dunnett posthoc tests in a, two-tailed unpaired Student's t-test in c,d,e). Data are from one experiment (d) or representative of two (a–c,e) independent experiments (mean±s.e.m. in a,c–e).

