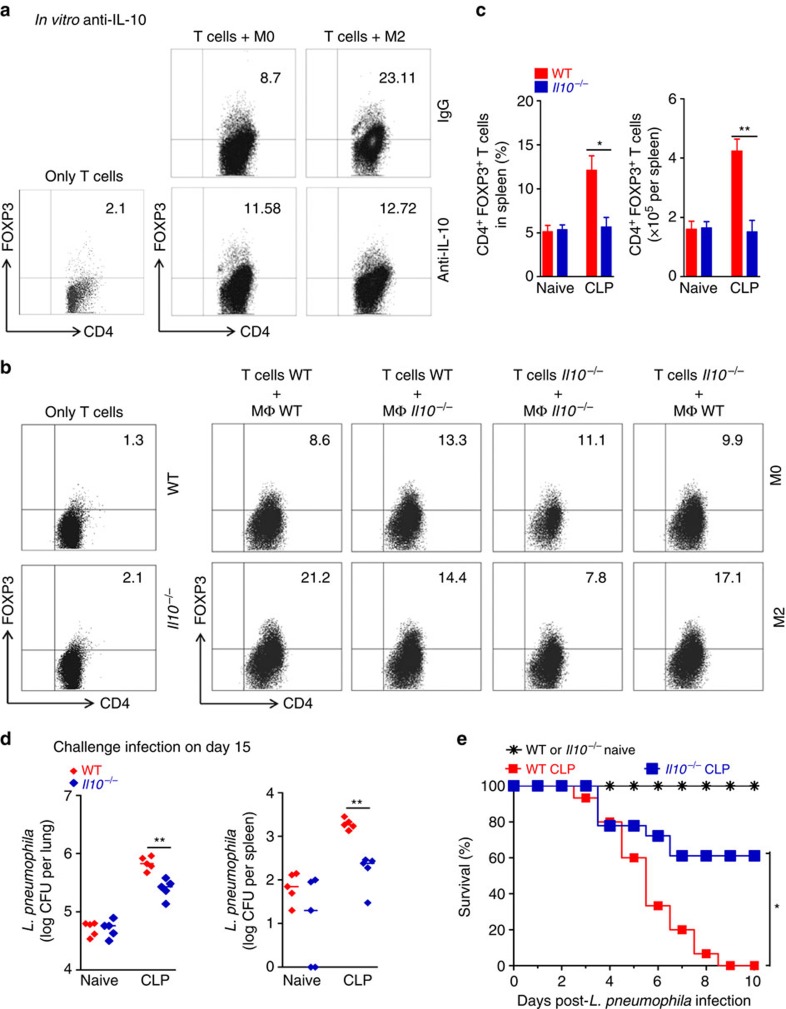
Figure 7. Expansion of Treg cell population by M2 is IL-10-dependent.
(a,b) BMDM from WT or Il10−/− mice were polarized to M0 or M2 phenotype and co-cultured for 4 days with CD4+CD25− T cells (purified from spleen of C57BL/6 J or Il10−/− naive mice) in the presence of IL-2, anti-CD3 and anti-IL-10, or medium alone. Percentage of CD4+Foxp3+ Treg cells was analysed by FACS. (both cell types pooled from five mice and pooled from five well per group). (c–e) Sepsis-surviving C57BL/6 J and Il10−/− mice were either killed or challenged with L. pneumophila on day 15 after CLP. (c) Frequency and the total number of Foxp3+CD4+ T cells in the lungs (n≥3 mice per group). (d) Bacterial load in the lungs and spleen 24 h after challenge (n=5 mice per group). (e) Survival curves of mice after challenge (n=15 mice for naive group, n=15 mice for WT CLP group and n=18 mice for Il10−/− CLP group). *P<0.05, **P<0.01 and ***P<0.001 (two-tailed unpaired Student's t-test in c, Mann–Whitney U test in d, Mantel–Cox log-rank test in e). Data are representative of three (c,d) independent experiments or pooled of three (e) independent experiments (mean±s.e.m. in c, median in d).

