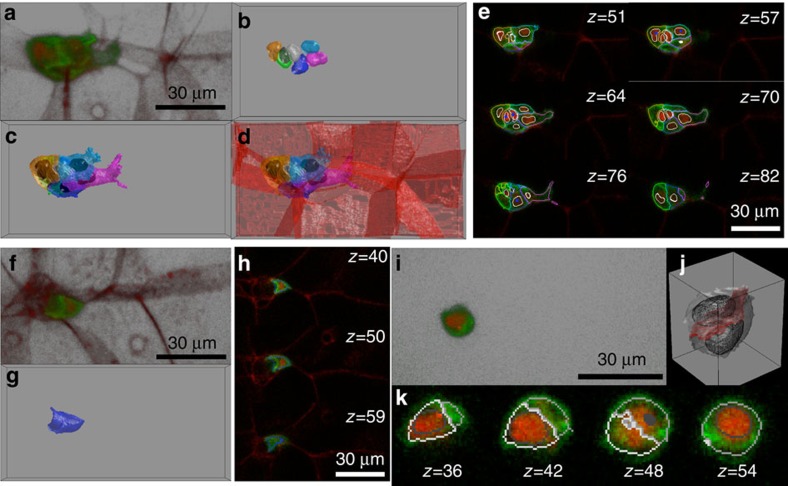
Figure 1. Segmentation and reconstruction of migratory cells and nuclei in the cluster.
(a) Z-projection of an original image stack at a single time point showing migrating cell nuclei (red), membranes (green) and nurse cell membranes (red). (b) Segmented nuclei with different cell identities in different colors. Two polar cells are in light and dark grey. (c) Reconstructed migrating cell surfaces in 3D with nuclei in black and surface colors as in b. (d) Reconstructed migrating cells/nuclei and nurse cell surfaces (red). (e) Cell boundaries of colors as in c and nuclei outlines (white) at different z-slices of a cluster in a. (f) Original image stack of single border cell labelling with border cell membrane (green) and nurse cell membranes (red). (g) Reconstructed single border cell surface in blue. (h) Slice view of the original signal overlaid with the border cell contour at different z-slices. (i) Original image stack of polar cell labelling. (j) Reconstructed polar nuclei surfaces (meshed surface) and cell surfaces (light and dark grey). Red indicates the interacting surface between two polar cells. (k) Slice view of the original signal with the polar cell surfaces (light and dark grey) overlaid at different z-slices.

