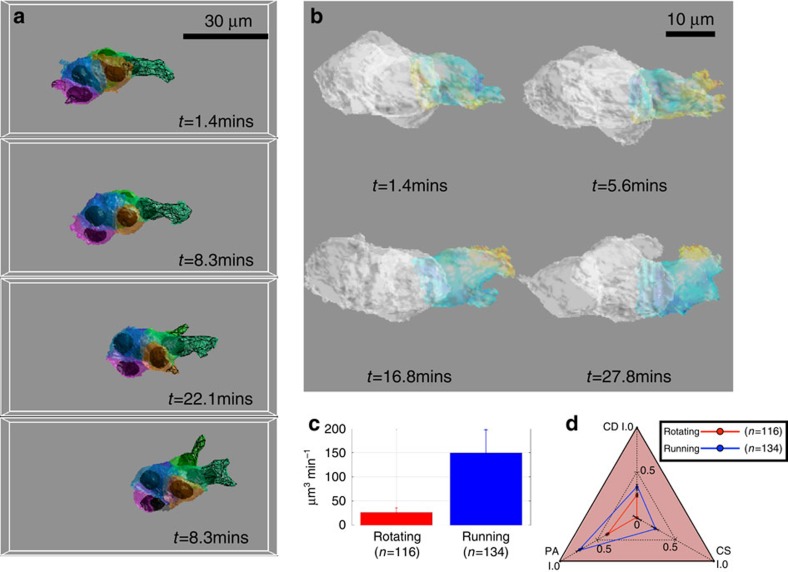
Figure 5. Cluster external protrusions are associated with cluster running.
(a) Cluster external protrusion detection and measurement at four different time points. The meshed surface indicates the cluster external protrusion and the color indicates which cell generates the cluster external protrusion. (b) The morphological dynamics of a leading cell of a running cluster (Supplementary Movie 11). Hotter color indicates bigger deformation. (c) Quantification of cluster external protrusion in rotating and running modes. During rotating mode, the cluster generates ∼25 μm3 min−1 protrusions, while during running mode it can generate much larger protrusions of 150 μm3 min−1. Error bar is the Standard Error of the mean. (d) Cluster external protrusion parameters differ during rotating and running modes. PA: alignment of each cluster external protrusion with cluster migrating direction, protrusion directions are first normalized, and the magnitude of the unit vector's dot product with the cluster direction (also normalized) is taken as PA. In running phase, the protrusions are more highly correlated with the cluster direction, i.e. the cluster moves along the cluster external protrusion direction. CD: the normalized protrusion direction vectors are added as a combined vector and its magnitude is correlated with that of the cluster speed as CD. This parameter indicates if the combined protrusion direction associates with the cluster speed magnitude. Again, CD is higher for running than rotating. CS: the correlation between protrusion mass and cluster speed, indicating whether the size of a protrusion is associated with cluster speed.

