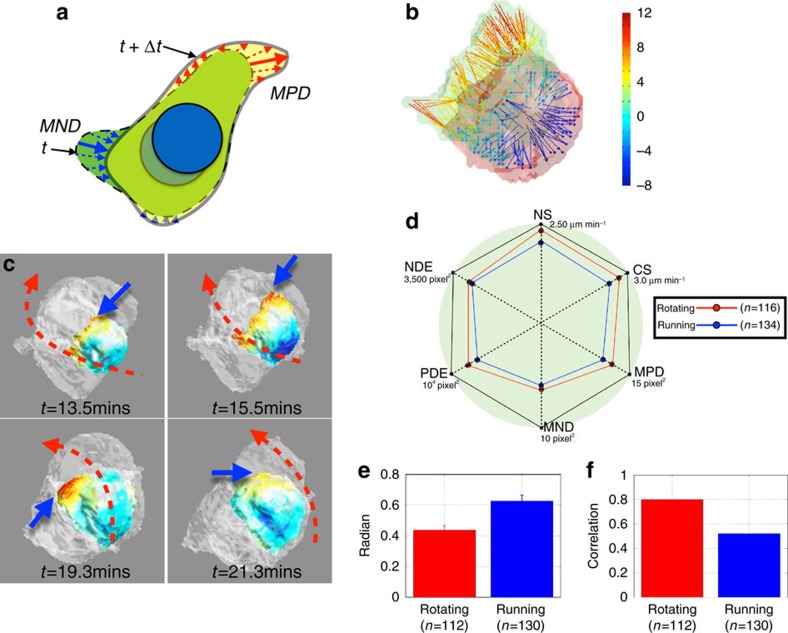
Figure 6. Cluster internal cell extensions are associated with cluster rotation and cells are more active during the rotating modes.
(a) Illustration of morphodynamics parameter calculations: the Maximum Positive Deformation (MPD), Maximum Negative Deformation (MND), Positive Deformation Energy (PDE) and Negative Deformation Energy (NDE). The solid red arrow is the MPD and the blue solid arrow is the MND. The PDE is the summation of all red arrows and the NDE is the summation of all blue arrows. (b) Morphodynamics of a border cell in 3D. Hot color indicates positive deformation and cold color indicates negative deformation. (c) Cluster internal cell extensions are associated with cluster rotation. Blue bold arrows indicate the cluster internal cell extensions of a border cell and the red dotted arrows indicate the rotating direction of the cluster. (d) Six measured parameters, including Nucleus Speed (NS), Cell Speed (CS) and those defined in a reveal that the cells are more active during the rotating mode than the running mode. Nucleus and cell speed are higher, and the cell front edges are more active, generating larger cluster internal cell extension during the rotation, while the retraction behaviour remains similar, indicated by the MND and NDE. (e) The angle difference between the cluster rotating vector (red arrow in Supplementary Fig. 12) and protrusion rotating vector (magnet arrow in Supplementary Fig. 12). The difference between these two vectors is often <30 degrees in rotating mode but much greater in running mode. Error bar represents s.e.m. (f) The correlation between the rotating speed and the positive protrusion amount. The correlation is about 0.80, compares to only 0.51 in running mode. This indicates cluster rotating behaviour is highly associated with the well-coordinated cluster internal protrusions.

