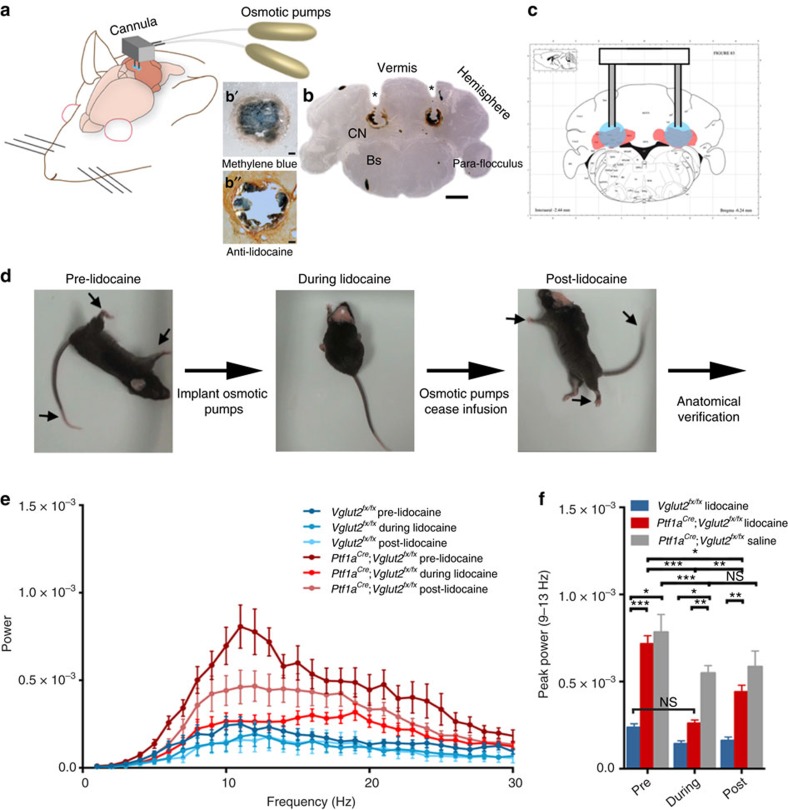
Figure 7. Lidocaine delivery to the interposed cerebellar nuclei eliminates tremor and improves movement in Ptf1aCre;Vglut2fx/fx mutant mice.
(a) A schematic example of delivery of lidocaine via osmotic pumps to a mouse cerebellum. Schematic adapted with permission, from drawings published in ref. 28. (b) Anatomical verification of surgical targeting of the cannula to the cerebellar nuclei. In the higher power view of where the cannula tip was located (b′), the methylene blue staining approximates the local impact of the lidocaine injection and (b”) the lidocaine immunodetection was used to examine the local spread of lidocaine within the cerebellar nuclei. Scale bar in (b), 1 mm. Scale bar in (b' and b”), 100 μm. (c) Atlas schematic75 demonstrating the location of the cerebellar nuclei (highlighted in red) and the bilateral infusion of lidocaine into the interposed nuclei (highlighted in blue). Schematic reproduced in part, with permission, from Paxinos and Franklin75. (d) Stills of videos of a dystonic mouse before, during and after lidocaine infusion. Arrows point to stiff extended limbs and tail. (e) Tremor power/frequency graph of Vglut2fx/fx and Ptf1aCre;Vglut2fx/fx mice before, during and after lidocaine infusion. Error bars are defined as s.e.m. (f) Quantification of peak power of Vglut2fx/fx (pre versus during: Student's paired t-test P value=0.1117), Ptf1aCre;Vglut2fx/fx (pre versus during: Student's paired t-test P value=0.0001) and Ptf1aCre;Vglut2fx/fx sham (pre versus during: Student's paired t-test P value=0.0068; during versus post: Student's paired t-test P value=0.2941). Vglut2fx/fx during versus Ptf1aCre;Vglut2fx/fx during Student's unpaired t-test P value=0.131; n=7 Vglut2fx/fx mice with lidocaine, 14 Ptf1aCre;Vglut2fx/fx mice with lidocaine, 4 Ptf1aCre;Vglut2fx/fx mice with saline. Error bars are defined as s.e.m. Either paired or unpaired Student's t-tests were used as noted. *P<0.05, **P<0.01 and ***P<0.001.

