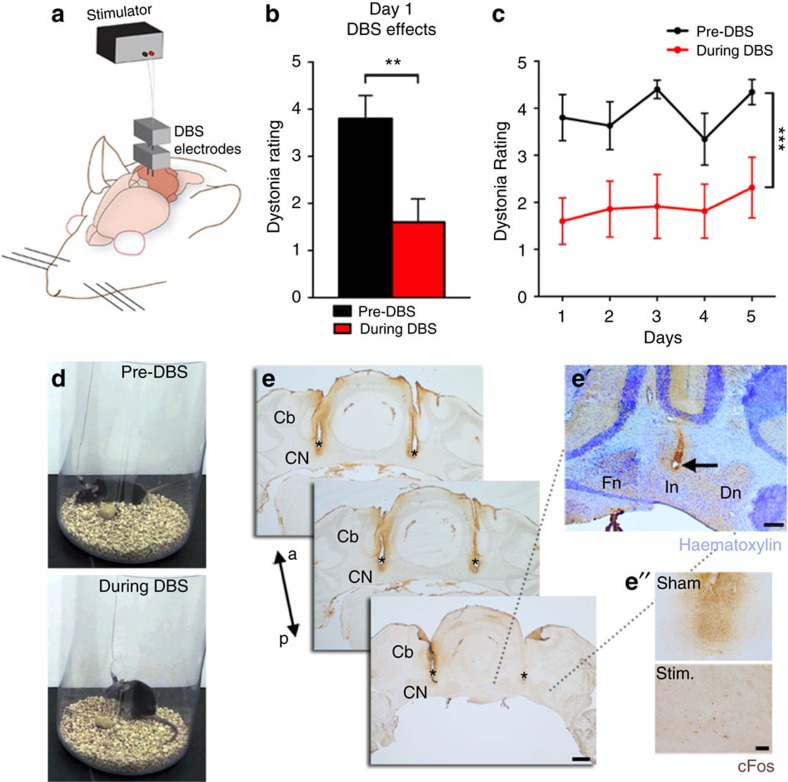
Figure 8. Deep brain stimulation of the interposed cerebellar nuclei restores mobility in severely dystonic mice.
(a) A schematic example of DBS targeting into the cerebellum. (b) Dystonia rating before and during DBS stimulation of the interposed cerebellar nucleus in naive Ptf1aCre;Vglut2fx/fx mutant mice (P=0.0014; n=7 mice; Student's paired t-test). There is no significant difference between pre-DBS and post-DBS suggesting limited residual effects once the DBS is turned off (day 1 pre-DBS (3.8±0.49) versus post-DBS (3.075±0.63) Student's paired t-test P value=0.1099). Error bars are defined as s.e.m. (c) Comparison of pre-DBS and during DBS dystonia ratings for each of the 5 days shows no significant difference between days in the pre-DBS dystonic rating or during DBS dystonic measures (pre-DBS days 1–5: F(2.454, 14.72)=2.762; P=0.0875; during DBS days 1–5: F(2.647, 15.88)=1.380; P=0.2841). A one-way ANOVA shows a between-treatment difference based on averages of pre-DBS, during DBS and post-DBS over 5 days of stimulation: F(2, 12)=31.42 (P<0.0001) (see also Supplementary Movie 8 for pre-, during and post-DBS effects). Control mice were not affected by DBS (please see Supplementary Movie 8, n=8 Vglut2fx/fx stimulated and 4 Ptf1aCre;Vglut2fx/fx shams). Error bars are defined as s.e.m. **P<0.01 and ***P<0.001. (d) Stills of a Ptf1aCre;Vglut2fx/fx mouse before and during stimulation. (e) Anatomical verification of surgical targeting of the DBS electrodes to the interposed cerebellar nuclei. Scale bar, 500 μm. (e') Haematoxylin counterstain (deep blue/purple) showing the site of electrode in the cerebellar nuclei. Scale bar, 200 μm. (e'') Compared with the sham, cFos expression (brown) is not upregulated by stimulation. Scale bar, 100 μm. Cb, cerebellum; a, anterior; p, posterior; CN, cerebellar nuclei; Fn, fastigial nucleus; In, interposed nucleus; Dn, dentate nucleus; asterisks, electrode tracks.

