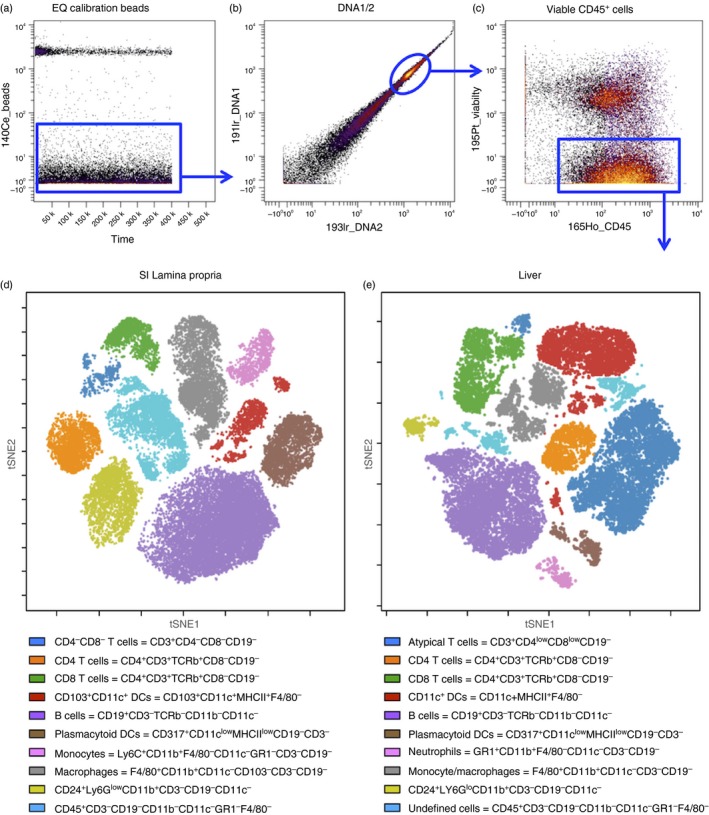
Figure 6.

ViSNE analysis of small intestine lamina propria and liver CD45+ immune cells. (a) Dot plot of EQ calibration beads (y‐axis) versus time (x‐axis); (b) Dot plot of 191lr_DNA1 (y‐axis) versus 193lr_DNA2 (x‐axis) on gated bead‐excluded cells. (c) Dot plot of 195P‐Viability (y‐axis) and 165Ho‐CD45 (x‐axis) gated on DNA1/2 double‐positive cells. (d, e) Dot plots depict tSNE1 (y‐axis) versus tSNE2 (x‐axis) of clustering after viSNE analysis for a representative sample from (d) small intestine lamina propria and (e) liver. Undefined cells in liver may include natural killer cells, innate lymphoid cells and others. [Colour figure can be viewed at wileyonlinelibrary.com]
