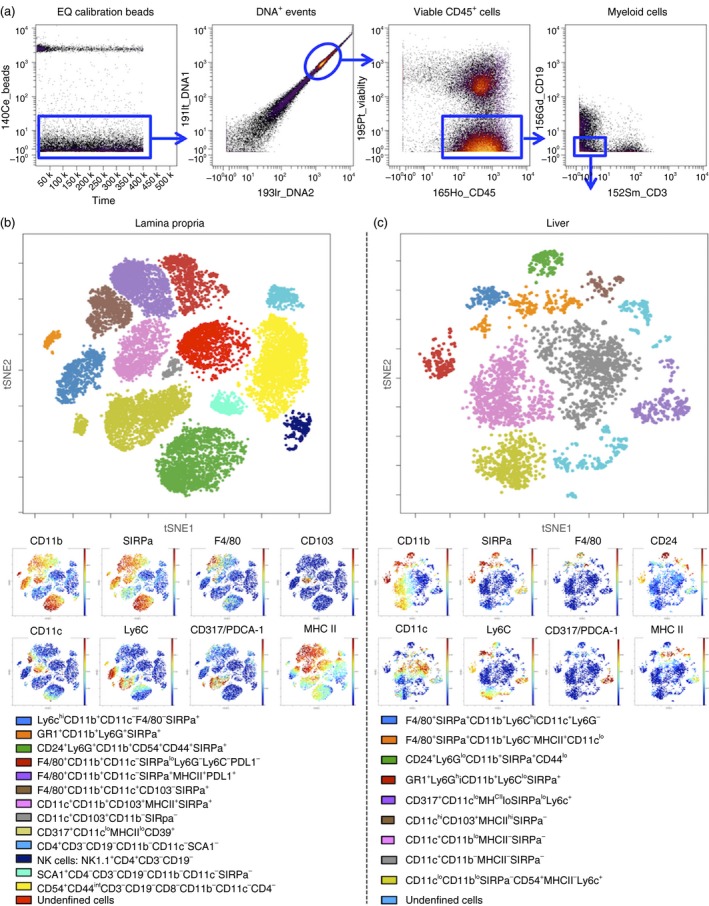
Figure 7.

ViSNE analysis of small intestine lamina propria and liver myeloid cells. (a) Dot plot of EQ calibration beads (y‐axis) versus time (x‐axis). (b) Dot plot of 191lr_DNA1 (y‐axis) versus 193lr_DNA2 (x‐axis) on gated bead‐excluded cells. (c) Dot plot of 195P‐Viability (y‐axis) and 165Ho‐CD45 (x‐axis) gated on DNA1/2 double‐positive cells. (d) Gating strategy to obtain live CD45+ CD3− CD19− myeloid cells for viSNE analysis. (e) Dot plot depicts tSNE1 (y‐axis) versus tSNE2 (x‐axis) of clustering after viSNE analysis for a representative sample from small intestine (SI) lamina propria with major myeloid populations labelled according to lineage marker expression (see key). Dot plots depict expression levels (red = high expression, blue = low expression) selected markers: CD11b, CD11c, SIRPa (CD172), Ly6C, F4/80, CD317/PDCA‐1, CD103 and MHC class II. (f) Dot plot depicts tSNE1 (y‐axis) versus tSNE2 (x‐axis) of clustering after viSNE analysis for a representative liver sample with major myeloid populations labelled according to lineage marker expression. Dot plots depict expression levels (red = high expression, blue = low expression) selected markers: CD11b, CD11c, SIRPa (CD172), Ly6C, F4/80, CD317/PDCA‐1, CD24 and MHC class II. [Colour figure can be viewed at wileyonlinelibrary.com]
