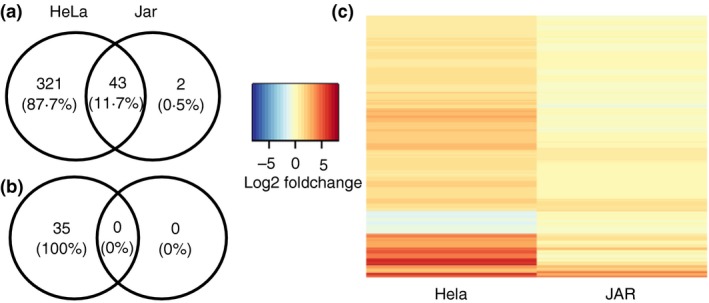
Figure 1.

Jar cells suppress interferon‐γ (IFN‐γ) responsive genes compared with HeLa cells: The number of (a) up‐regulated and (b) down‐regulated genes upon IFN‐γ stimulation of HeLa and Jar cells are represented by a Venn diagram. (c) Heatmap representing mean of Log2 (Fold change) of differentially expressed genes in IFN‐γ stimulated HeLa and Jar cells relative to the unstimulated cells. Colourmap ranging from blue to red represents low to high mean of the fold‐change from four independent experiments. Differential expression compared four IFN‐γ‐stimulated samples with four unstimulated samples and was defined as a mean of the absolute fold change of at least two relative to the unstimulated cells and a significant (q < 0·05) change in expression by DESeq2.
