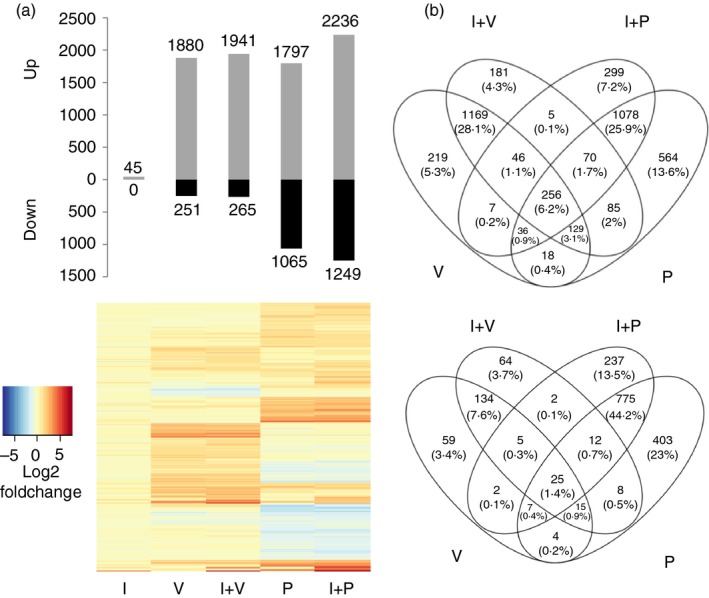
Figure 2.

The transcription response of Jar cells upon inhibition of protein tyrosine phosphatases (PTPs) and histone deacetylases (HDACs): (a) Differentially expressed genes (upper panel: absolute fold change, ≥ 2; false discovery rate < 0·05) and their fold changes (lower panel) were measured for each treatment by comparing their levels of expression (x‐axis) with unstimulated cells (horizontal axis). Colour map ranging from blue to red depicts low to high log2 (fold change). (b) Venn diagram showing overlap between the up‐regulated (upper panel) and down‐regulated (bottom panel) genes upon treatments with V (valproic acid, which is an HDAC inhibitor), I (human interferon‐γ) +V, P (pervanadate, which inhibits PTPs) and I+P.
