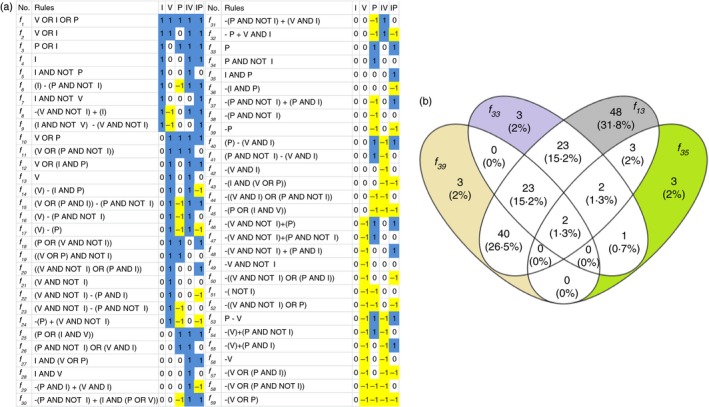
Figure 4.

System‐wide optimization of logic rules and promoter analysis: (a) All 59 rules (second column) describing differential expression patterns (blue/1 = up‐regulation, white/0 = no significant difference and yellow/−1 = down‐regulation) of 5635 genes upon stimulation with human interferon‐γ (I), valproic acid (V), pervanadate (P), I+V and I+P (horizontal axis). (b) f 13, f 33, f 35 and f 39 governed 50% of the differentially expressed genes. The promoter analysis reveals enrichment of several transcription factor binding sites. The distinct patterns described by the f 13, f 33, f 35 and f 39 rules are expected to be governed by a subset of transcription factors unique to those gene clusters, and are depicted by grey, purple, green and yellow colours look different, not the ones described colours, respectively. [Colour figure can be viewed at wileyonlinelibrary.com]
