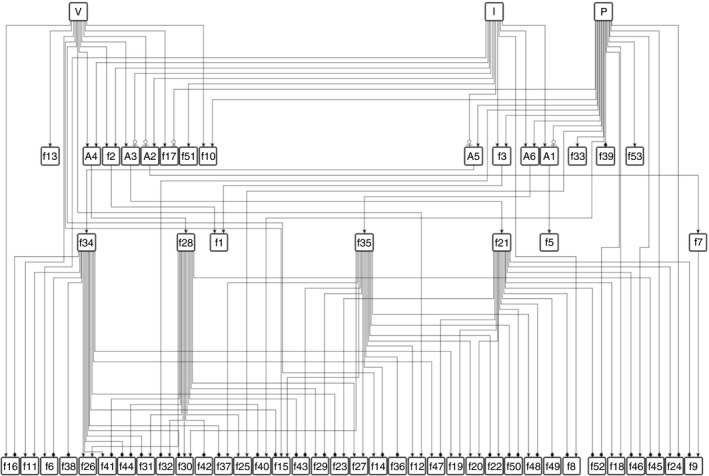
Figure 5.

Gene‐regulatory network: interactions between gene modules is represented by a hierarchical network where node names with prefix f represent rules described in Fig. 3 and prefix A represent ‘AND’ logic. Edges with directional arrows represent  : up‐regulation,
  : inhibition and
  : down‐regulation.
