Figure 1.

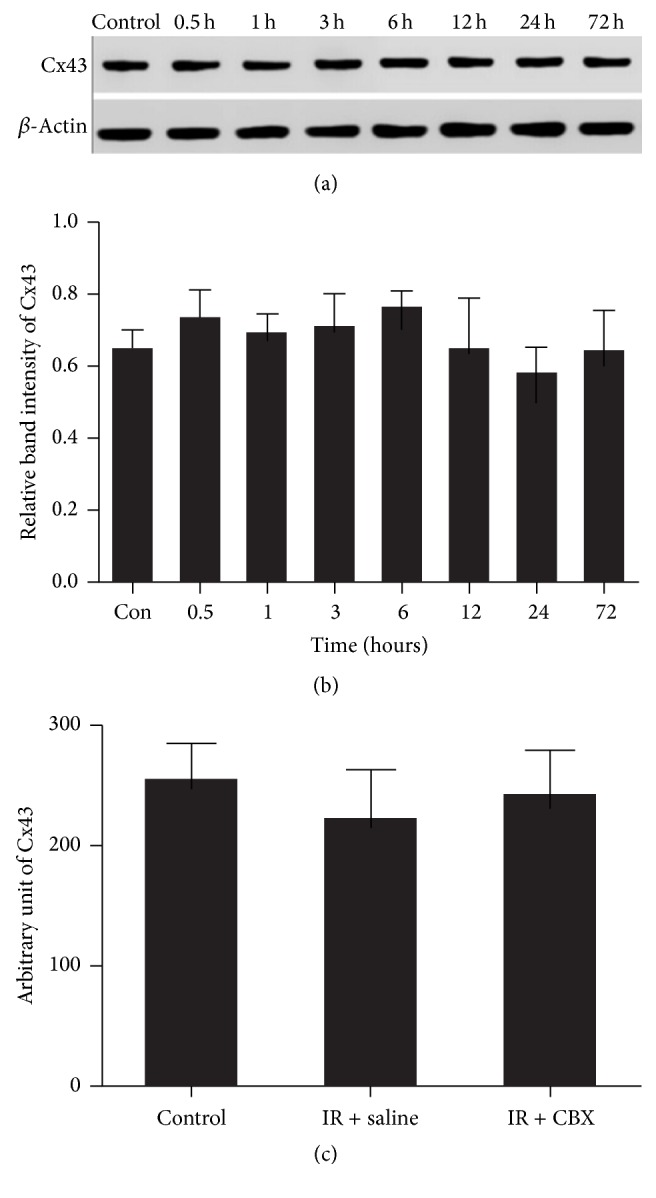
Representative western blot of Cx43 in the normal and at different time points of IR/OGDR groups. (a) The first stripe was Cx43 protein; the other was β-actin as the internal stripe. (b) Cx43 protein relative expression. There was no significant difference among the groups at each time point (P = 0.307). (c) Representative graph of fluorescence intensity value of Cx43 in normal and IR/OGDR 6 h (saline/CBX) groups. There was no significant difference among the three groups (P = 0.208).
