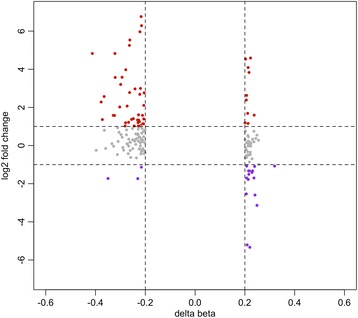
Fig. 4.

DNA methylation changes associated with gene expression changes in the TCGA cohort. Starburst plot showing correlations between gene expression changes and DNA methylation changes in DMRs with Δβ >20%. Red dots indicate up-regulated genes in HPV(+) cases with a minimum logFC >1. Purple dots indicate down-regulated genes with a minimum logFC < –1. Grey dots indicate genes with expression changes –1 < logFC < 1 and changes in methylation with Δβ >20%
