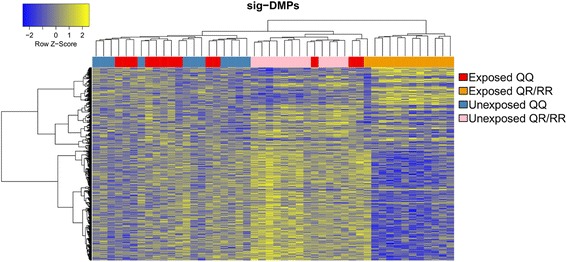
Fig. 2.

Heatmap clustering representation of the sig-DMPs. Heatmap of the methylation values from the sig-DMPs showing a clear cluster of prenatal pesticide exposed PON1-192 R-carrier samples (orange group). Hierarchical clustering is based on the euclidean distance and average linkage metric. Higher methylation values are colored in yellow, while lower methylation values are colored in blue
